


6/29/20
Long Term Bottom: Natural Gas
Collapsing output and potential for unprecedented winter demand (via solar minimum), may provide a long-term floor for nat-gas.
With horror stories of million dollar losses on small trading accounts (oil going negative), it seems prudent to trade ETF vehicles (not a recommendation), UNG and leveraged fund UGAZ.

2/20/2020
Nat Gas report due: 10:30 a.m. EST
Looking for a spike test lower to fill the gap from Tuesday’s open
Charts by StockCharts
2/16/20
Natural Gas
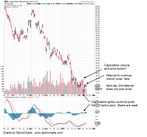
Both the daily and the weekly MACD are posting a bullish divergence.
The Money GPS reports here, that China's basic materials demand (Time 3:42) has 'fallen off a cliff'.
Prices are depressed. The technicals indicate this is the danger point, where risk is least.
Charts by StockCharts
1/30/20
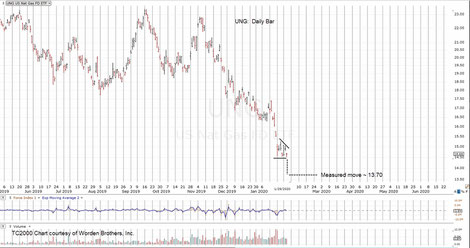
UNG is posting a terminating wedge with measured move target in the vicinity of 13.70.

12/14/19
Nat-Gas Reversal
Natural Gas UNG, is at the danger point and set to reverse.
Note how close the past three weekly closing prices are to each other. It’s an indicator of potential trend-change.
Charts by StockCharts

11/26/19
Nat-Gas: What’s going on?
We’re nearing winter and nat-gas is pushing lower. The usual excuses are provided about ‘temperatures moderating’ and so on.
That may be true for the moment. The real story behind the temperature change is best described in this report. The jet streams are shifting as a result of solar activity.
When they decide to shift back over the continental U.S. and if they do so this winter, we’re likely to see nat-gas demand go to unexpected levels.
In the meantime, prices are being driven lower and possibly to the Fibonacci projection as shown for UNG.
Note how these Fib levels are being ‘respected’ by UNG. The price action itself tells us there’s a probability for UNG to go below 18.50, before reversing higher.
One would expect, if nat-gas approaches a test of the multi-year lows, Andrew Waldock would be putting out one of his reports detailing the ‘commercials’ going long at record levels.

11/8/19
Nat-gas up. Nat-gas down. Which is it?
Gas is higher on lower inventory build … but wait, just a few hours later, it’s lower on forecasts for ‘moderate’ temperatures.
Meanwhile, back at the ranch in Utah, the coldest (potentially) October temperature ever recorded for the lower 48. Time stamp 2:24.
The Wyckoff method does not account for any financial news or press releases but only the price action itself.
That action is testing, probing a right side trend-line for UNG. With the lowest seasonal temperatures ever recorded, probabilities favor an absolutely brutal winter.

11/5/19
UNG: Wyckoff Spring In-progress
The four-day chart of UNG gives one interpretation of current price action. The multi-year low in early August may be seen as a spring set-up. Then, we have a sign of demand that is followed by the ‘proverbial gut-check’ as David Weis puts it.
Now, UNG is a spring in progress.
Higher nat-gas prices tie in with fundamentals of 7,112 new all time low temperatures set during the last 30-days for the Continental U.S. (time stamp 7:10)
“… it’s getting colder not warmer; and it’s getting colder fast”
quoted from our Grand Solar Minimum post.
Thursday’s nat-gas EIA report (10:30 a.m. EST) should be interesting.
11/1/19
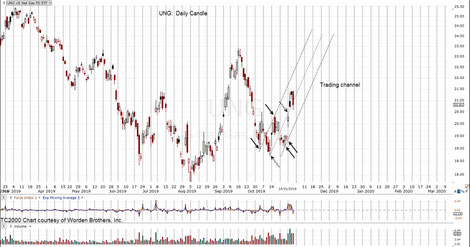
Record Cold: UNG Trading Channel
This link reports that cold temperatures are breaking 100-year old records. Of course, the potential for a complete weather shock was provided on this site months ago.
Now, here we are.
Nat-gas has spiked up over the past week and appears to be coming back for a test.
The potential trading channel is shown. A tongue-in-cheek poke at the renewable energy proletariat is at this link; effectively stating that natural gas prices are likely to go stratospheric.
When or if that happens, there may be a heartfelt change to get coal fired power plants back on line; More on that later along with analysis of BTU.

10/22/19
Nat-gas (UNG) to Rally?
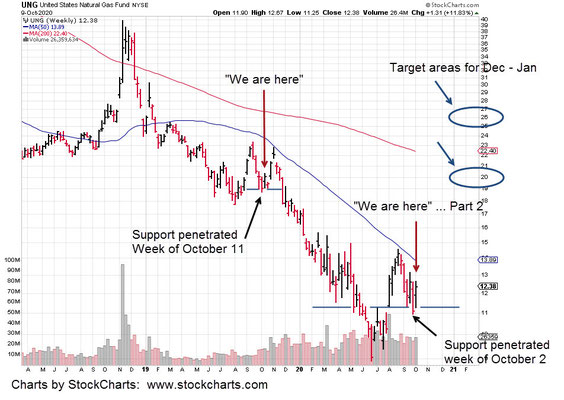
UNG has penetrated support and is now in test configuration for a Wyckoff spring.
Today’s down volume contracted over 56% from the prior session … indicating the down-thrust (Test) may be complete.
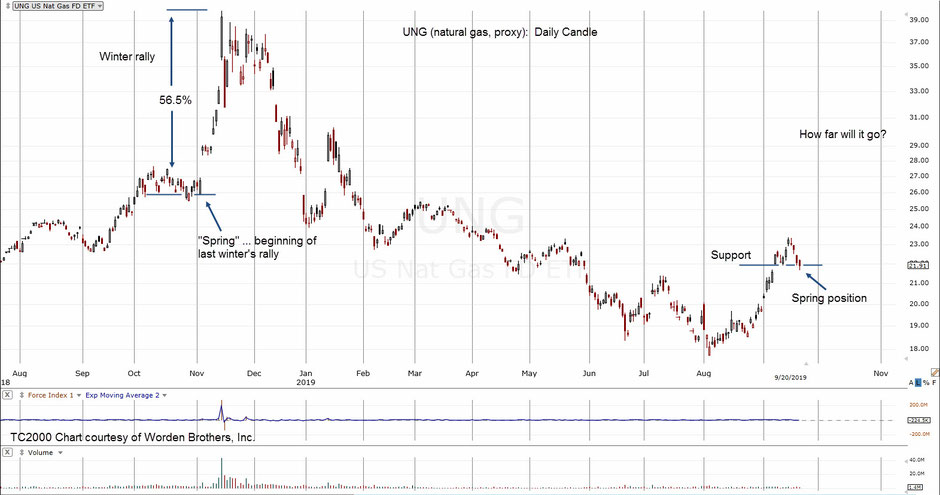
Seasonality favors a rally of some type. The included chart shows the effects of last year’s winter rally.
Charts by StockCharts
10/10/19
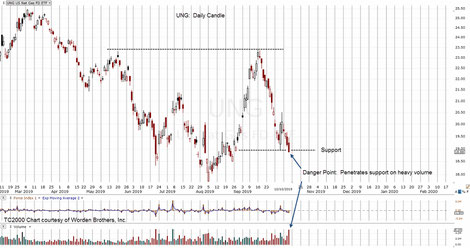
Danger Point
As expected, nat-gas (UNG) penetrated support during the session. Not expected was the close below support combined with shallow penetration and heavy volume.
In Wyckoff terms, we have ‘effort vs. result’. It took a lot of effort (volume) to get UNG, to close low.
We’re at the danger point where risk is least.
Also of note: At this juncture, nat-gas is back near multi-year lows; Right in the face of an already record breaking fall-winter.
At the same time, 'official' sources are forecasting a 'warmer-than-average' winter. It's just like Baghdad Bob saying there were no American troops in the city ... as the camera catches a glimpse of U.S. forces rolling past in the distance.

10/9/19
EIA Report Thursday, 10:30 a.m EST
The nat-gas report is due out tomorrow. Depending on price action, it may be an excellent opportunity to open a position in advance of winter.
Fall appears to have been vetoed in the north-west states and has gone straight to winter. Snowfall at record highs with temperatures at record lows.

10/3/19
UNG Pre-Market
UNG has negated the previous trading channel analysis and may be heading for something more opportune.
The EIA report is due out at 10:30 a.m EST. The consensus is for nat-gas inventories to build. We’ll see.
9/26/19
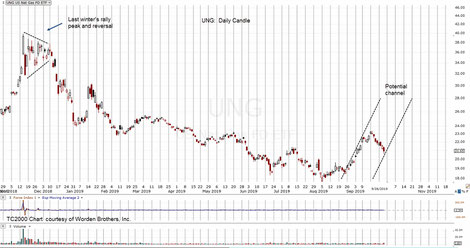
UNG has been updated to show a new potential channel.
The EIA report may have succeeded in thrusting UNG prices lower to help define the right side channel line. Weather forecast is here.
Snow accumulation for Northern Hemisphere is at time stamp: 22:20, here.
9/25/19
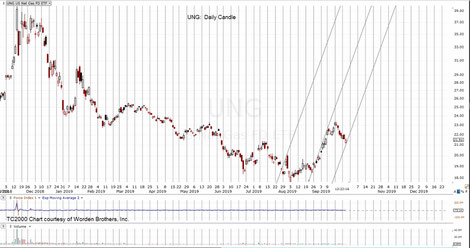
UNG to $100, by January?
Here is a revised channel of UNG … possibly the initial stages.
Time Stamp 22:20 at this link shows record snow accumulation for the Northern Hemisphere one month ahead of schedule.
It’s early and unknown for UNG. However, by the time it becomes fact, it’s time to unwind positions.
EIA nat-gas report, tomorrow.
9/23/19, 11:58 a.m. EST


9/20/19
UNG: Spring Position
Nat-gas, UNG is back in spring position ... penetrating just below support.
9/2/19
Nat-Gas Up 7%
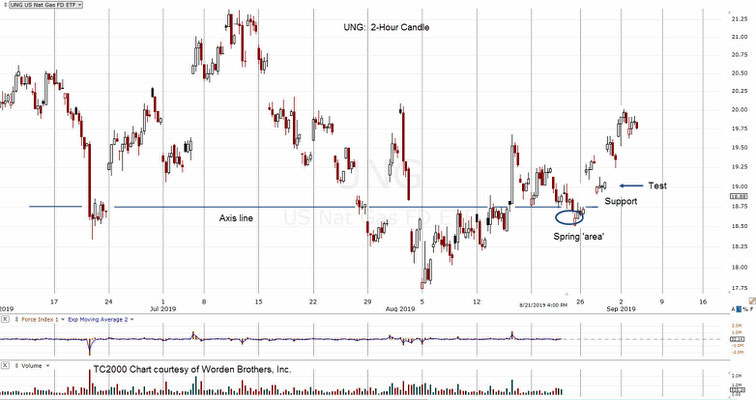
We’re up about 7% form the ‘spring’ lows identified on August 22nd.
Important to note: Area for reversal identified in advance; including approx. distance of travel (blue oval).
Subsequent to the push below support, we had the initial stages of a spring then followed by a test.
Now, nat-gas is up 7% and at another resistance area. There has been no real ‘gut check’ yet and it may still happen. A sharp, threatening price action move lower, could provide the opportunity for an aggressive but low risk entry.
8/26/19
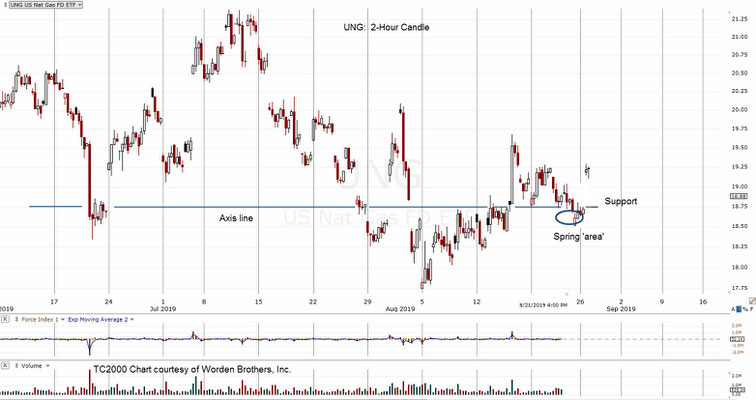
UNG Spring in Progress: Up 2.94%, Early Session


8/22/19
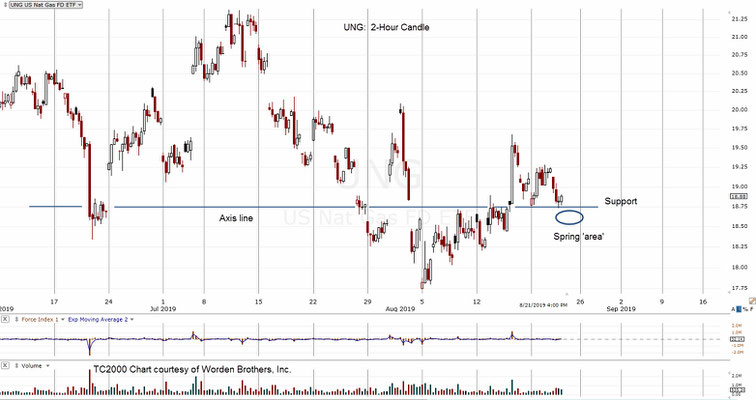
Nat-gas lower at support, pre-market
It’s early in the pre-market for nat-gas (7:43 a.m. EST) and UNG is trading lower, at support: 18.70 – 18.77.
A push below that support which halts and hesitates (after the EIA report, 10:00 a.m. EST), may indicate spring position and a reversal; potentially signaling a last stop at this level for the season.
A deeper sustained push, would point price action to test the August lows.

8/17/19
Nat-Gas To Test Lows?
Nat-gas showed signs of demand the past week but it may not be over for the downside.
The chart of UNG shows a channel breakout attempt that has failed … thus far.
Since the market seems to be using the weekly EIA report each Thursday as an excuse to move prices, we’ll use that as a timing mechanism.
So, we’re looking for a test low (if nat-gas moves lower from here) somewhere around this coming Thursday or Thursday, next.
The clock is ticking. Summer temperatures while moderate and not supporting demand at this point, may be forecasting a brutal winter to come.

8/15/19
Mid-session, 1:20 p.m. EST
Nat-Gas Negates New Lows
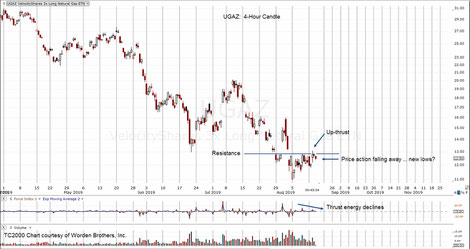
Nat-gas broke to the up-side through resistance. It’s mid session with UGAZ currently at 14.20.
With such a well defined S-R boundary, one can expect some kind of test (of the 13.00 –area) in the coming sessions.
8/14/19
Nat-Gas To New Lows
Natural gas price action (UGAZ) points to possible new yearly lows.
Pre-market activity had nat-gas higher. At the market open, that lead had eroded.
We’ve exited our long position based on this data and are now on the sidelines.

8/10/19
Run Silent Run Deep
The Friday, August 9th, edition of the Wall St. Journal has a half-page article about how ‘climate change’ is going to forever alter our eating habits.
It’s yet another global warming propaganda piece that is miss-directing the unaware and easily swayed public to think the earth is heating up.
Of course, the exact opposite is true. Here’s one more link to a report that supports yesterday’s report that supports the report from the day before. We’re cooling down … fast.
Meanwhile, far from all the babble is natural gas … Run Silent Run Deep
Nat-gas is at the danger point and under the radar. It may be in the process of forming a reversal that leads to its first sustained up-trend of the season … heading into fall and winter.
Of course, the very next session could completely negate the attached chart analysis. That’s the way of the markets.
However, if we get continued pressure higher and potentially breach the resistance area, the initial trend (22,000%, annualized for UGAZ) would be aggressive, indeed.
It’s hardly noticeable. If we’re at a pivot, only later will this point in time have clarity.

8/8/19: Nat-gas, Bearish Consensus?
Here's a brief video with bearish stance on nat-gas
Paraphrased comments below:
- Nat-gas is in a negative market … and has been for ages
- No scenario where rallies can be taken seriously
- Higher levels offer opportunities to short this market
- We’re going to test lower at $2.00, support
The annotated chart shows current situation as of today’s close. It’s true that we’re at the underside of a major boundary.
However, the price action from mid-June to now, can be seen as penetration of longtime support and then congesting at that low.
We’ve already had a minor spring higher in today’s session. Now we’re at the larger resistance boundary.
Different this time, are fundamental factors not the least of which is the possibility for a record breaking cold winter.
Summer has already been mild which helped to draw prices lower. It seems the quiet summer has put all but the attentive few to sleep as well.
As David Wies said (when trading springs), if prices move lower, we’ll be stopped out … “so what?”
Taking a significant position at the danger point in his words, are for those “who have the nerve.”
We’ll see.
8/8/19 (9:15 a.m. EST)
Natural gas report release, 10:00 a.m. EST
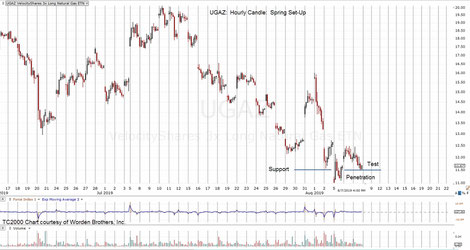
Hourly candle chart of UGAZ shows nascent trend reversal. Yesterday’s session may have been a test of the multi-year lows … setting up a spring condition.
Pre-market activity shows UGAZ trading slightly higher.

8/3/19: Nat-Gas Penetrates Lower, Then A Reversal
Natural gas has a vicious push below support and then pivots upward.
The ‘gut-check’ discussed in the 7/31/19, update (below) is upon us. What happens next may define the true intentions of the natural gas market.
The fundamental background remains the same. It’s even in our faces on a near daily basis.
It’s unusually cold in England and crops are in trouble. Right here in Ft. Worth, it did not reach a 100-degree high until late July; something that has not happened since 1989.
Cooler temps in the middle of summer. What’s going to happen this winter?

7/31/19: Natural gas shows strategic potential
Yesterday, a spring set-up was identified. Today, there’s confirmation.
Next, we watch for the “proverbial gut-check”.
As explained in the Weis video, at times a spring in progress will have a one or two day adverse move; a gut check, to see if you can hang on.
Depending on how or if that move transpires, we’ll look to add to our position that was established last session around 2:00 p.m. EST.
The timing appears to be in synch as it’s getting to be mid-summer. Sometime in the near future, the market’s focus is going to shift to the fall and winter months.
It’s important to establish a strategic, low risk position early as commodities tend to have blow-off tops that are especially violent. It’s best to watch and be in such moves early and well in the green so that one can think (and exit) objectively.

7/30/19: Spring Position, Play It Again
The June update had natural gas in spring position. Indeed, there was upward price action following that report. However, it stalled, returned lower, penetrating support during the past two sessions.
That puts us in spring position again.
The press (link here) is attributing the lower moves to cooler weather that has natural gas prices dropping to a 3-year low.
Price action seems to be very short sighted. Cool weather in the middle of summer? What temperatures are coming this winter?
Anecdotally, as I went outside early morning a few days ago here in North Central Texas (just west of Ft. Worth), it was COLD. Not cool or mild, but cold.
This link shows July 25th low, at 65-degrees in the city!
These data points are connecting the dots for a potential disastrous (if not already) crop harvest and then bitter, potentially record-breaking cold into the winter
months.

6/30/19 Natural Gas (UNG)
With natural gas (UNG) penetrating support and failing to move lower, we’re now in spring position.
Because the sector has pushed below levels not seen since June of 2016 (futures market), there’s a potential for a significant, strategic reversal.
Note the gap between the 6/21/19, weekly close and the following 6/28/19, weekly low. Supply (downward pressure) may be exhausted.
High volume bullish ETFs for this sector are (but not limited to): UNG (1X) and UGAZ (3X).
Charts by StockCharts