


9/27/20
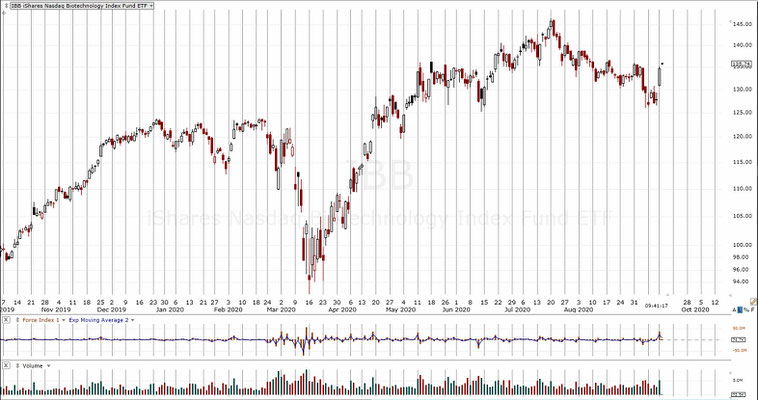
IBB Trading Channel
Thrust energy declines as IBB price action approaches established trading channel.

9/20/20
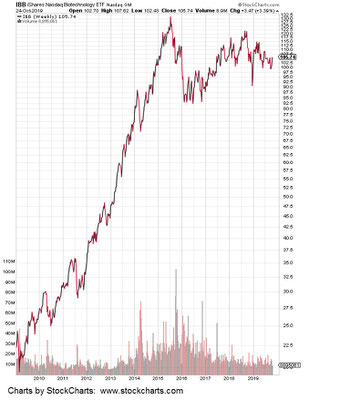
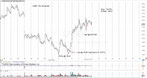
AMGN Breakout Wedge
The inverted chart shows AMGN, ready for upside breakout.
Latest fundamental analysis from SeekingAlpha is in this report.
Using fundamentals, all is well at AMGN. Price action is presenting a different story.
Charts by StockCharts
9/19/20
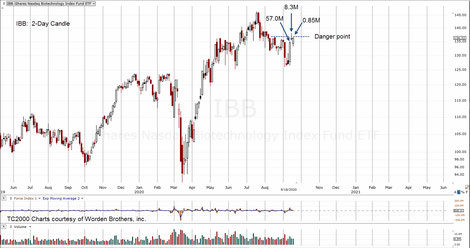
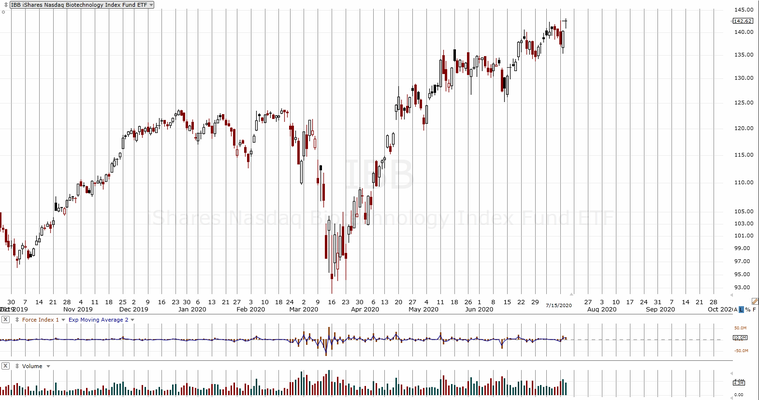
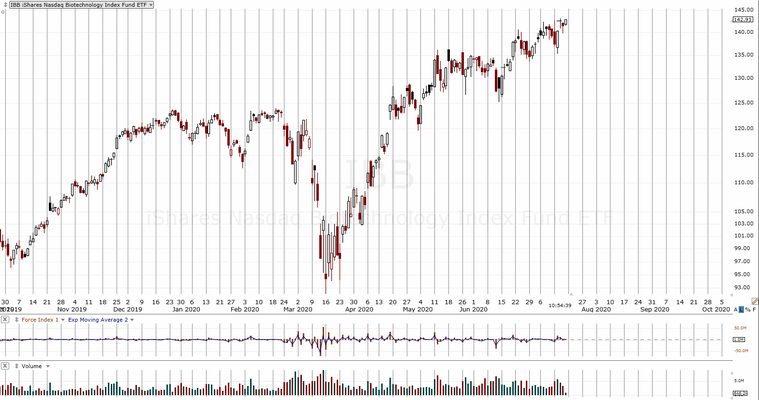
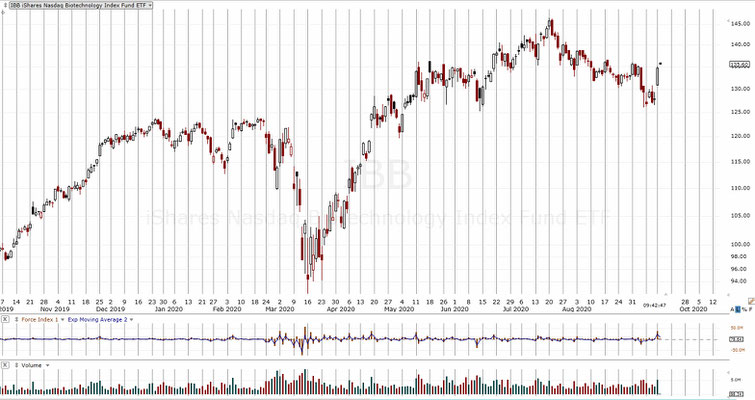
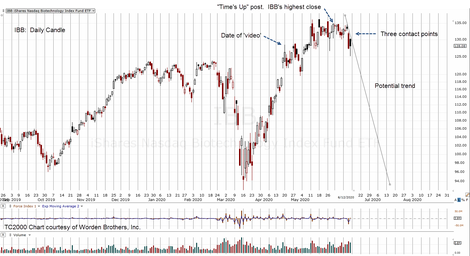
Thrust Energy Evaporates
The 2-Day charts shows a series of upward price action thrust to the 50% retrace, with declining energy.
The inference is, some kind of retrace or outright reversal would be required to move to higher levels.
No matter. We have a hard stop location for any short positions (not advice, not a recommendation) at the high of the week, IBB 138.05

The IBB sequence below, identifies and documents the all-time high for IBB. On the last candle at the high, note the uptick in daily volume.
Sometimes markets are subtle. There is no sure-fire indication of a top ... other than increased volume with little upward progress.


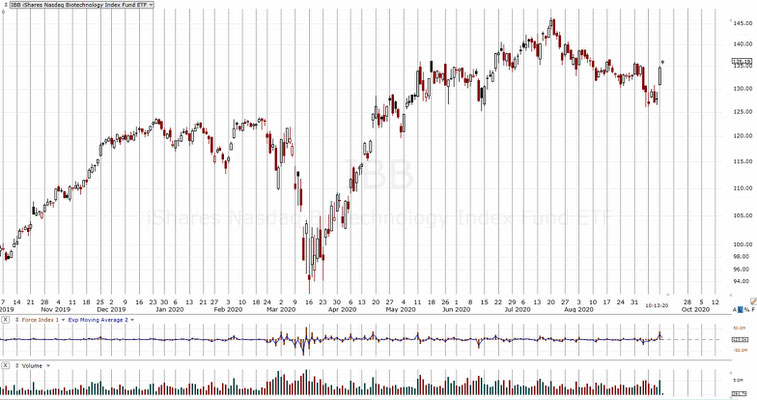


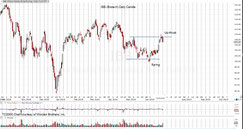
TC2000 Charts (above) courtesy of Worden Brothers, Inc.

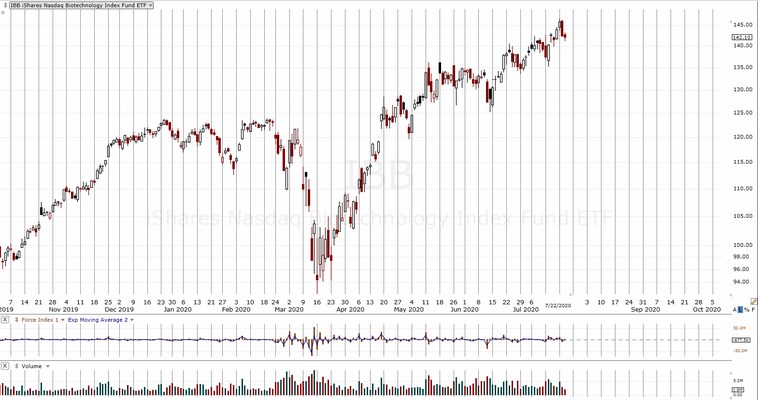
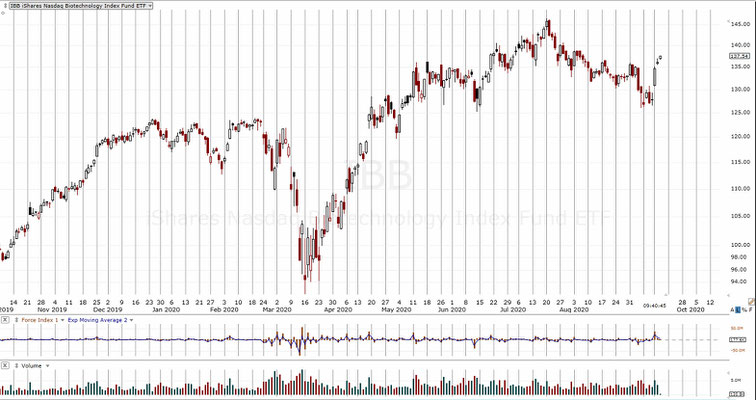
7/4/20 Biotech: Shortened Thrust
Upward thrusts shorter and shorter.
As IBB was nearing zero upward progress, a short position (using BIS, 2X inverse) was opened (note grey oval on chart).
Subsequent price action inched higher and the BIS position (not a recommendation) is at a small but manageable 3.32% loss.
Charts by StockCharts

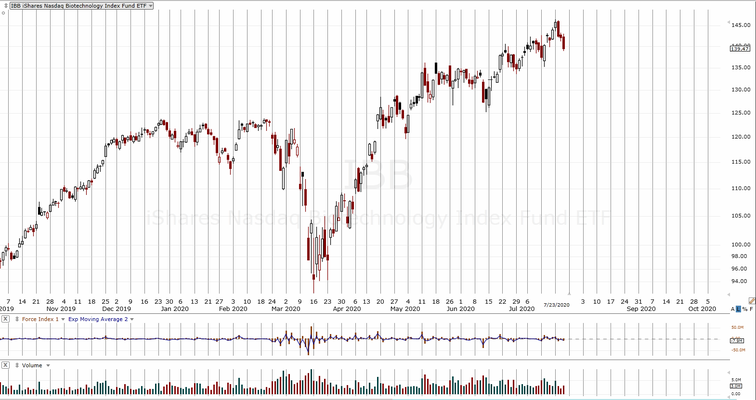
6/26/20 Biotech: Fibonacci 5-years
IBB is just one month shy of an exact five years since its high in July, 2015.
Long congestion periods build up the potential for a sustained move in the opposite (down) direction.
Inverse funds (not a recommendation) are BIS and LABD.
Positioning short via BIS is shown here.
Charts by StockCharts

6/17/20
Biotech: Relative Strength
Longer term, IBB looks to be out of bullish fuel.
Charts by StockCharts
6/13/20
Biotech: Reversal & Nascent Trend
Continued downside within the trend will give more credence to a long term reversal scenario.
It's still very early and subsequent action could instantly negate the set-up.
This is the danger point where risk is least (not a recommendation).
Link to "Time's Up" analysis is here.
Video analysis is here.

6/9/20
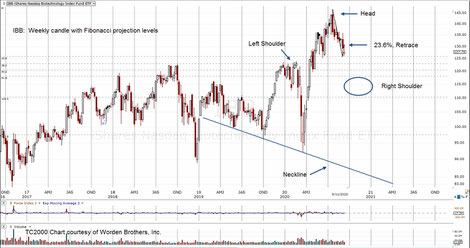
Biotech: Wedge Break & Test
Technical factors that favor a reversal are the wedge formation itself; then followed by a break on decisive volume.
At the last session, there was a test of the wedge underside.
Weekly MACD is lower than prior week … indicating dissipating momentum.
Charts by StockCharts

6/5/20
IBB: Tight Action
Price action tends to tighten up before a significant breakout.
Of course, IBB could go either way.
However, with the overall market making successive daily (recovery) highs and IBB not participating, the inference is for a break to the downside.
Inverse funds (not a recommendation) are BIS (2X inverse) and LABD (3X inverse). Warning: Inverse funds can 'blow up' at any time. Like the Corvair: 'Unsafe at any speed'.

5/28/20
Biotech At Danger Point

5/14/20
Biotech Trends Down
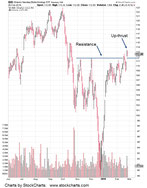
At the open, IBB opens gap-lower below support. This level has now become resistance.

5/13/20
Biotech Reverses.
Short trade vehicles for this sector (not a recommendation) are BIS (2X inverse) and LABD (3X inverse).

2/27/20
Biotech Bear
A sideways market is a bear market.
The one sector that looks to have the best potential for a sustained and deep mover lower, is Biotech (IBB).
The P&F count (target shown) indicates potential for a move to the 48 – 50 area. Fibonacci projection (not shown) has IBB going to 38 – 40, in a sustained down move..
No matter the method used, it’s a long way down.
Inverse funds for this sector are the 2X inverse BIS, and the 3X inverse LABD. The 3X inverse fund has significant downward bias error and thus is only used for a day trade or one that is projected to last only a few days.
BIS is the better selection (not financial advice) for a sustained longer term move.
Charts by StockCharts

2/25/20
Tape Directed Action
The LABD (inverse biotech) trade was opened and closed in just over one market day; 6.5 hours.
Trade action was based only on tape indications.
This is exactly as Wyckoff described. Financial news and corresponding ‘analysis’, must be eliminated so that all energy is focused on reading the tape.
From the February 23rd update, the low risk response to market action was to go short the biotech sector or as it turned out, any other sector as well.
However, biotech is unique when compared to the other indices or sectors such as the Dow, S&P, Semiconductors (SOXX) and NASDAQ 100.
That difference is the amount of built up energy or ‘congestion’ in the price action. Biotech (IBB) has gone sideways for years … having reached its high way back in mid-2015. Congestion equates to projection.
IBB has built up enough congestion to project a downward break (should it happen) from current levels (118 – 120), all the way to the 49 – 50 area.
Supplemental note:
LABD was re-entered early in this session at 12.14; about 2.5% cheaper from yesterday’s exit.
LABD current trading at 13.05
Update: 2:31 p.m. EST
LABD Closed at: 13.6243
Gain: 12.23%
2/23/20
Biotech Reversal
If the Monday open in Biotech (IBB) is unchanged or lower, the weekly MACD histogram will show a lower value and provide additional weight to a potential reversal.
I don’t use technical indicators per se, but monitor them for confirming (or diverging) action.
Truth is in the price action itself. Shown on the daily chart of IBB is a potential wedge formation that appears to have failed.
In a wedge, price action typically breaks out and then comes back to test (or touch) the breakout line. In our current case, that test penetrated back into the wedge itself.
This is a very subtle indication and it could be blown away with subsequent action on Monday, the 24th. However, all serious tape readers look closely at nuances that untrained eyes can’t see.
As a side note, price action and the tape were being monitored and recorded as the high (123.58) of the session was reached. Interesting to note, that high was posted with the following tape:
Price Size
123.54 100
123.54 219
123.56 217
123.57 100
123.58 1,000 High
123.57 100
123.575 100
123.57 200
123.535 100
123.54 100
123.52 100
123.51 100
123.53 150
123.5297 150
123.50 100
One thousand shares posted at the daily high and it never (for this session) came back.
The previous chart on the weekly close of IBB shows it’s in up-thrust position; therefore at the danger point.
Either way, risk of a short position at this juncture is low. Biotech stocks are already extended. To move substantially higher, they may need to move lower, first.
2/20/2020
Early Session: 11:33 a.m. EST
Biotech Reversal
‘Buy its own action’, the biotech sector has posted a Wyckoff up-thrust and is reversing lower.
Stated many times on this site and in the Biotech (IBB) section, this sector never came along for the current ride to new highs.
Now, it looks like it’s in serious trouble. A lower weekly close will help confirm the up-thrust.
Four years of sideways action from 2015-to-present, IBB has significant downside potential. We’ll see.
Charts by StockCharts

11/14/19
Biotech in Up-thrust
It’s an interesting picture. A price pattern that’s potentially as old as the market itself (spring to up-thrust); a measured move that is in near perfect symmetry.
With the disclaimer that anything can happen in the market, if IBB reverses from here, it’s in a good position (from a technical standpoint) to drop to the low 90s.
That’s a potential 18% move lower.
Note:
The magenta dashed line measured move, is an exact cut-and-paste copy of the existing, spring to up-thrust trading range.
Charts by StockCharts
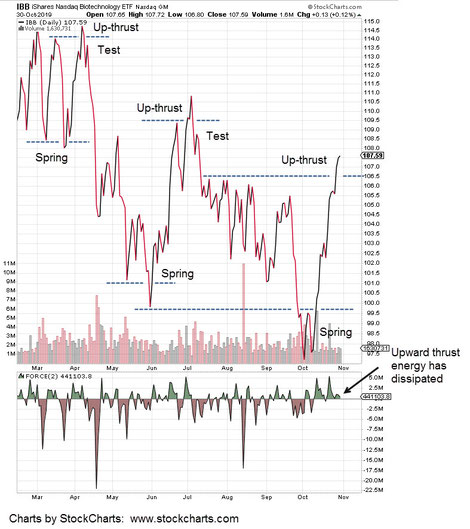
10/31/19
Biotech Stretched
The biotech sector (IBB) continues to set-up in a potential reversal. The chart of IBB shows two prior reversals that were both preceded by a spring.
The current up-thrust appears to be taking its time.
The wide and fast 10-point move from 97.50 to 107.50, has opened up the potential for a 20-point move to the downside.
That would be 10-points down, testing the range and if there is a break lower, a measured move for another, 10-points.
From a percentage standpoint, it’s a potential drop that’s nearly 19%.
Nineteen is close to twenty and getting ourselves way out in front, we’ll know the move is possibly over when the financial media talks about the ‘Biotech bear market’ being down 20%.
For now, price action dictates trade action.
We’re in up-thrust condition at the danger point; where risk is least.
Charts by StockCharts

10/29/19
Biotech Up-thrust
Biotech (IBB) continues to be in up-thrust condition. The daily close chart has price action penetrating known resistance and closing above that resistance.
Can it hold?
Take a look at the last time this happened earlier in the year. The answer then, was no.
Charts by StockCharts
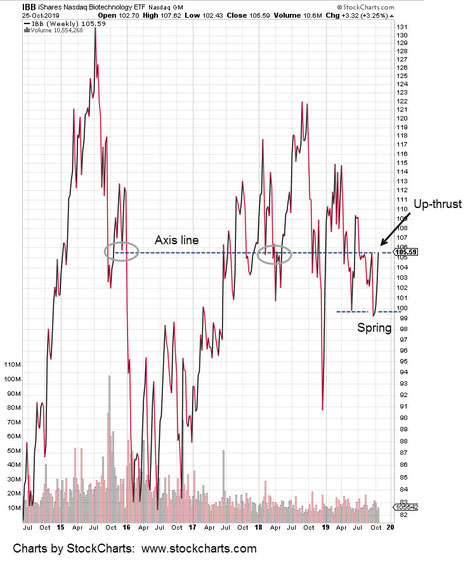
10/26/19
Biotech: The Canary?
Is Biotech (IBB) the canary in the coal mine?
The weekly chart gallery from Friday’s (10/25) pre-market update shows a potential series of price action contact points that imply we’re at a pivot.
The close for IBB on Friday ended lower from the prior session; possibly hinting, the down-move has started.
On a weekly close basis, we see a spring to up-thrust condition; yet another clue.
Unlike the real estate index (IYR as proxy) there is really no dividend providing support for IBB. Current yield stands at 0.14%. Source: www.bigcharts.com
So, this is it. Monday’s action will add to the confirmation of a pivot lower or begin to chip away at the potential.
Two inverse funds for Biotech are BIS and LABD. However, LABD has significant bias errors and is really just a day-trade vehicle.
Obviously, this is not a recommendation.
Charts by StockCharts


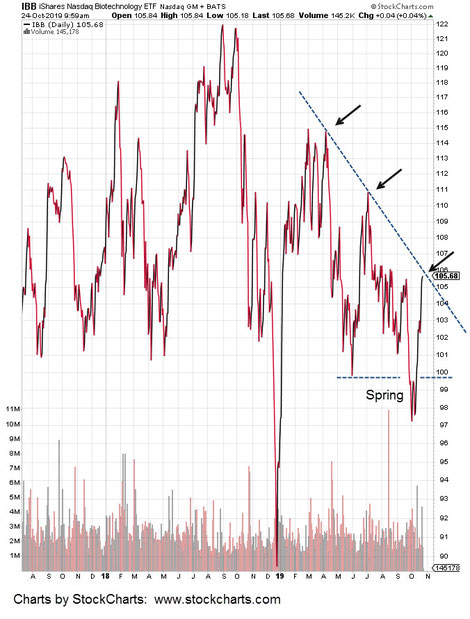
10/24/19
Biotech (IBB) Hits Trend Line
10:15, a.m EST
It looks like IBB is at well established resistance.
Note how the spring set-up was used for price action to launch into resistance.
Charts by StockCharts

7/15/19: IBB, Pre-Market at 8:27 a.m. EST
Oscillating around support and resistance is normal market behavior.
For Biotech IBB, we’re at the juncture between spring and gap-fill higher and/or contact and verification of an aggressive -91%, annualized trend-line.
If we look at the highly liquid and leveraged inverse fund LABD, pre-market activity shows it trading slightly lower indicating IBB will open slightly higher.
If so, IBB may open right into the nascent trend-line as shown by the gap-fill arrow on the chart.

7/12/19
Biotech (IBB) Gap-Lower Open
It’s nearly one hour after the open and Biotech (IBB) may have posted a breakaway gap lower, a spring higher, or both.
Once a prior low has been penetrated, it’s natural market behavior to attempt a ‘spring’ off that low. Whether or not the spring action will hold is the question.
In a decided down trend, the spring action fails and the market continues lower.
IBB appears to be at that juncture now just sixty-minutes after the open. We see a breakaway lower that may or may not hold depending on the spring attempt.
The important part is to understand where one is in the move. Right now, we’ve had a gap-lower open and are in spring position.
The overall trend still remains down and probabilities favor continuation of that trend.
Charts by StockCharts

7/9/19
Biotech (IBB) At The Danger Point
Evidence of a struggle is what we see in Biotech (IBB) as it twice attempted to breakout higher.
Price action has come to underside resistance as a test. The important element at this juncture is volume.
Today’s volume contracted to 1.3-million, down 71.74%, from the previous session
The prior two sessions were each down on heavy volume: Friday’s action was down on 3.4-million and yesterday’s action was down on 4.6-million.
The expectation for the next session is a lower open followed by a continuation of the downside.
However, if there’s additional pressure to the upside or price action hesitates, probabilities decrease significantly for a swift move lower.
Charts by StockCharts

6/30/19 Biotech
Biotech (IBB) continued lower for two days and then reversed to post a higher daily high. The trend appears to have changed and the short position (via BIS) was exited early after the open on Friday, the 28th.
The loss on the trade was a minuscule three-tenths (0.34) point for the entire position … having made five entries as the index moved lower.
The weekly chart shows a potential spring albeit with a deep penetration below support and a reversal higher. Resistance areas are noted.
Charts by StockCharts
'
6/25/19: Biotech Pivot Point
As the S&P makes new highs, one market in particular is not participating.
Biotech (IBB) made its all time high years ago in July of 2015. About that time, David Stockman issued a report essentially calling it: 'Two Trillion Dollars of Bottled Air'.
I’ve traded this sector often but in the past few weeks, its become especially interesting as IBB posted the sought after “spring to up-thrust” set up.
There's no guarantee of a swift and sustained reversal from this point. However, this is where probabilities coalesce into a low risk opportunity.
We’re at the danger point; price action can go either way.
High to moderate liquidity inverse funds for this sector are BIS (2X inverse) and LABD (3X inverse).
It’s important to note that LABD has significant downside bias and I do not trade this fund except on a very short (a few days) time-frame.
The BIS has less leverage and is less liquid but has a much improved (inverse) tracking of the IBB.
3/11/19:
Biotech Short Trade Closed With 20% Gain
The biotech sector was shorted over the last week and the trade closed out on Friday 3/8/19.
We shorted by going long the leveraged inverse fund LABD at the location shown. There was a slight draw-down of less than 1% before LABD moved higher.
It was a modest trade with a gain of nearly 20%. However, the more important part was the gain relative to the amount risked.
Although the actual low occurred after the entry, it can still be used for illustrative purposes.
Let's say you’re managing a modest (corporate) account of around $5-Million and decide to risk a tiny portion of this account on the trade. We'll put it at $10,000. This means that you would have purchased about 62,500 shares of LABD.
With an R-Gain of 22.47, your $10K (risk) now becomes nearly a quarter million dollar gain at $224,700 within about four days time.
The objective in the markets is to minimize the risk and minimize the time spent as well.
In the case of the LABD trade above, both objectives were accomplished.
Obviously, the corporate trade scenario is an idealized presentation.
However, the fact that LABD was entered where volatility (and risk) was minimal and exited near the top of the move is proof in itself that Wyckoff technique still applies today in a financial world choked with obfuscation and the beast of 'artificial intelligence'.
Lions and tigers and Watson ... oh my!
2/27/19 (before the open):
IBB Up-Thrust
Unlike the rest of the major indices, Biotech (IBB as the proxy) made its high years ago in July of 2015.
Now, at this juncture, IBB is posting an up‑thrust that has potential to become a full blown reversal.
As with the other markets, we’re at the danger point.
This is the area and time where risk is least. A failure (with a short position) would likely result in minimal loss while a reversal with new lows, may yield significant gains on the short side.
Back in 2015, David Stockman analyzed the Biotech sector; concluding that it was nearly ‘two trillion dollars of bottled air’.
If we're posting an up-thrust and reversal, IBB may have just run into the pin that pricks the bubble.

3/4/18: Biotech put in February nets over 1,000% gain
The IBB Put option trade is a good example of why downside action is preferred.
While option calls may net a few hundred percent gain as in the GLD trade… puts are a different story altogether.
Using our near-expiration method, it’s one day to expiration for the 2/9, IBB 104.00 Put. All hope is lost with a contract price near zero at: 0.20.
Understanding where one is in a price move is critical. On February 8th, the down move in IBB does not appear to be finished. Price action over the prior two sessions rebounded modestly and appears to be in a stall.
Action moved sharply lower during the 8th and the early part of the 9th. Real time tape reading was used to determine that we’re at an extreme and the trade was exited (with over 1,000% profit) mid-session as shown.
No more than a few minutes later, IBB began an upward move that ultimately culminated in a 105.67, close for the session.
Had the IBB put been held into the close, it would have expired worthless.