


11/24/20
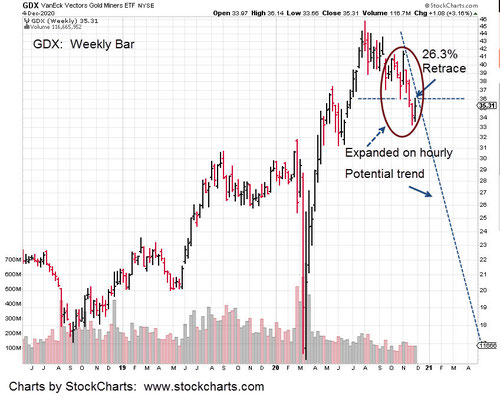
GDX: Weekly Candle with Fibonacci Projections
11/16/20
GLD Charts for Danger Point, update below


11/1/20
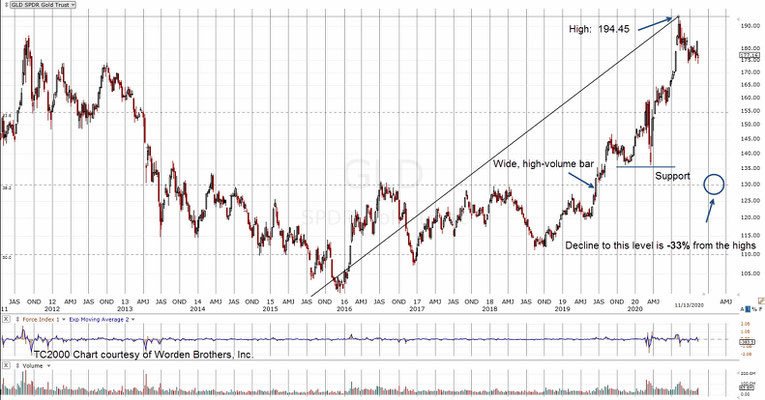
GLD: Forecast Higher Into Resistance

10/21/20
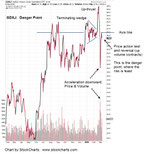
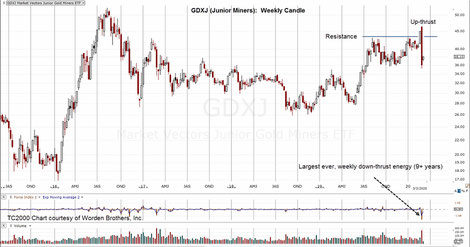
GDXJ
Data Point No. 5: Danger Point

3/15/20
Gold: The Reversal
Website prognosticators have herded the unsuspecting and uninformed into gold and or gold stocks. They say gold is going to $2,000/oz. or $5,000/oz. or even $50,000/oz. and beyond.
Here is an example, the visceral result of herd mentality.
What does the tape say? What is truth?
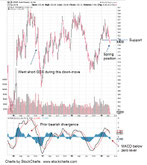
At this juncture, GLD experienced the largest down-thrust energy since the week of 9/23/11; nearly nine years ago. From a short term perspective, GLD has pushed below established support and is spring position. A rally from here is possible.
How price action behaves at this juncture will tell us if GLD may be headed to new highs or if the rally (should it occur) will fail and usher in new lows.
Either way, the junior miners (GDXJ) have dropped -58%, from top to bottom in just three weeks: This past week’s decline was the largest ever for the ETF. It appears to be a mortal wound no matter what transpires from this point.

3/12/20
“Sit Tight”
The August 1st post (scroll down to 8/1/19) identified a bear market bounce; preparing the trading mind to go against overwhelming bullish consensus.
Now that a down-move appears to be well underway, the monthly chart of GDXJ shows us what can be expected.
As noted on the chart, the last significant (impulsive) down leg lasted about nine months before a new monthly high was posted. Within that leg, were five successive down months; lower monthly lows and lower monthly highs.
So, using Livermore’s admonition of ‘get right and sit tight’, we’re doing just that.
3/8/20
Danger Point: Junior Miners
Danger point; where the risk is least. That risk on a short position via JDST, is 0.74-points, as measured form the close (to the low) on Friday (3/6/20).
Risking $1,000 (not financial advice) gives a JDST position size of approximately 1,350 shares.
Using an intra-day entry (at a lower JDST price), the position size could be much larger. The expectation going forward, is for JDST to continue higher; GDXJ lower.
The juniors have severely lagged the price of gold and have formed bearish divergences both on the daily and weekly charts.
Should this trade work out, the short (long JDST) entry has been seven-months in the making from the bearish analysis first published (on the seniors, GDX) last August 1st, 2019.
Charts by StockCharts
3/6/20
The Tape Says Gold
It’s before the market open and pre-market activity indicates the Junior Gold Miners (GDXJ) may be completing their counter-trend move.
JDST, the 3X inverse of GDXJ is trading up slightly as of this post.
Up volume of GDXJ as shown on the daily chart has contracted in the past two sessions by 51% and 21%, sequentially. Commitment to the up-side appears to be evaporating.
Gold itself (GCJ20) looks to be making a double top or a test of the prior high.
3/3/20
Junior Gold Miners About To Collapse?
Weekly chart on GDXJ shows the largest ever down-thrust energy. The chart data used in the analysis goes all the way back to the week of August 13th, 2010.
The usual suspects, the YouTube prognosticators are pointing in one direction (up) while chart data, the tape, points in the opposite direction.
Recent price action penetrated the support around the 36.00, level which actually puts GDXJ in spring position. That’s what is occurring at this juncture; a possible counter-trend bounce.
If the analysis is correct, the spring attempt will fail and GDXJ may enter free fall right along with gold … to the surprise and dismay of nearly everyone.
2/26/20
GDX Price Action: Forecast months in advance.
Two monthly charts are provided to show how they can prepare one to take action (confidently and) completely opposite of the herd.
Back at the beginning of August last year, was the forecast for continued upward corrective action in the senior gold miner index (ETF) GDX.
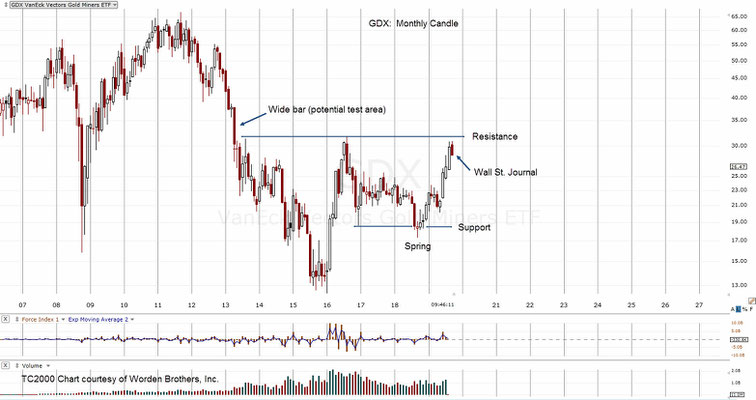
Along the way, there was help from the Wall St. Journal and other web prognosticators that gold was on a tear. Forecasts for gold to reach $10,000 and $50,000 were resurrected, dusted off, and trotted out.
Fast forward seven months to now
Two charts are below. The first is the original forecast that includes exactly where gold or more specifically GDX may hit resistance and reverse.
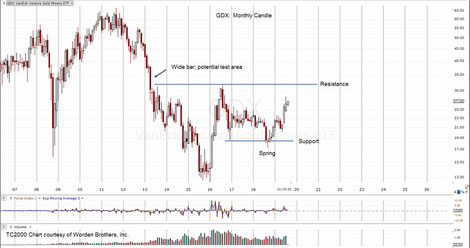
The second is now. We see clearly that GDX penetrated resistance slightly and is pulling back.
This is the danger point, where risk is least
Going short at this juncture is opposite of what must be the entire heard … well as least the uninformed public. Andy Waldock posted some time ago (along with Notes From The Rabbit Hole), the professionals are going short at record or near record levels.
The pros live, breath, and eat their respective sectors. It’s best to take serious note of their actions … especially when it lines up with your own independent forecast.
On the opposite side of the trade (from the pros) are the big speculators … the hedge funds. Hedge funds sound great but are not much different from the mainstream.
Case in point is this article from some years back. If you are attending the same well-connected elite parties, get-togethers, TED Talks or whatever, you eventually wind up being your own herd.
Both Wyckoff and Livermore preferred and operated in isolation. It’s the only way they could be mentally tough enough to position against the mainstream consensus.
Original August 1st GDX monthly chart is below along with an overlay of updated price action.


2/4/2020
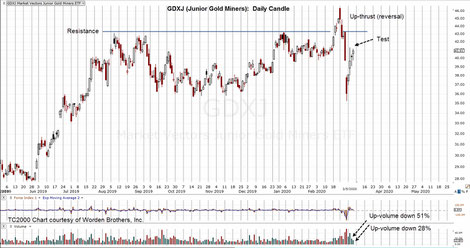
GDXJ: Junior Mining Index Reversal
The long term perspective on what the Commercials and the Speculators are doing can be found at this link.
The bottom line is: Once again, the commercials are at, or near all time record short levels on gold.
The last time this happened in a big way, my firm took advantage with the “GDX” put option trade.
11/7/19
Before the open
Junior Mining ETF (GDXJ): Headed Lower
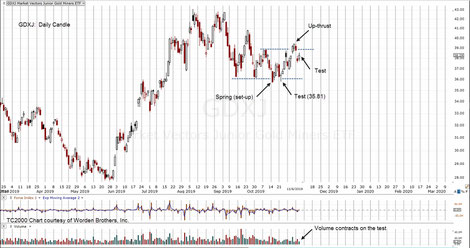
If the chart of GDXJ has been read correctly and the pre-market action continues lower, GDXJ is poised for the downside.
Posting a new daily low below 37.71, adds weight to an up-thrust (then lower) condition.
Note the weakness of the prior spring test. Price action came all the way back down to 35.81, before heading higher to the up-thrust.

10/15/19
Using Force Index
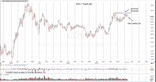
The annotated chart of GDXJ (Junior Gold Miner ETF) shows the progression into the latest reversal.
The Force Index, is a summation of market pressure for each leg whether up or down. Note how upward force in the latest up-leg dissipated as highlighted by the two magenta numbers.
This pattern of fading energy, coupled with reversal can be found as an example of going short the market in Wyckoff’s 1931 manuscript of how to trade in stocks.
If this exact chart set-up is in his text, these patterns are as old as the market itself and they repeat.
With about thirty minutes to go in the pre-market session, GDXJ is trading slightly lower at 36.92, down -0.32%.

10/14/19
Before the Open
The Junior Mining index GDGXJ appears to be in a downward reversal. Top to bottom has been retraced 38% as shown. Now, it looks to be in a trading channel as well.
Pre-market activity has the index flat. The channel has neither been confirmed, or negated by early trading.
Pressing on to a new daily low (below 37.48), will help confirm the downtrend.
9/7/19
GDX Nearing The Top
It’s been over a month since the last update on GDX.
Price action is following the plan with the move nearing its upside limit at established resistance.
Another good indicator we’re at or near the top of the current move, is the Wall St. Journal. It came out with a nearly full-page article (Friday, 9/6/19) on the precious metals which have ‘been on a tear’.
If we are nearing a top, the GDX may take a while (possibly months) to complete its reversal.
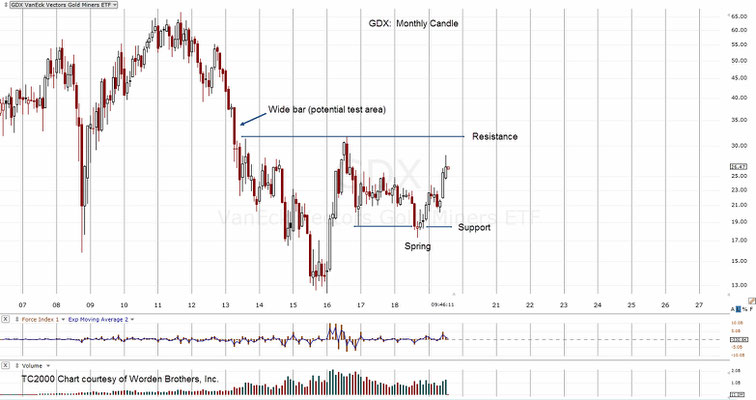
8/1/19: GDX Long Term
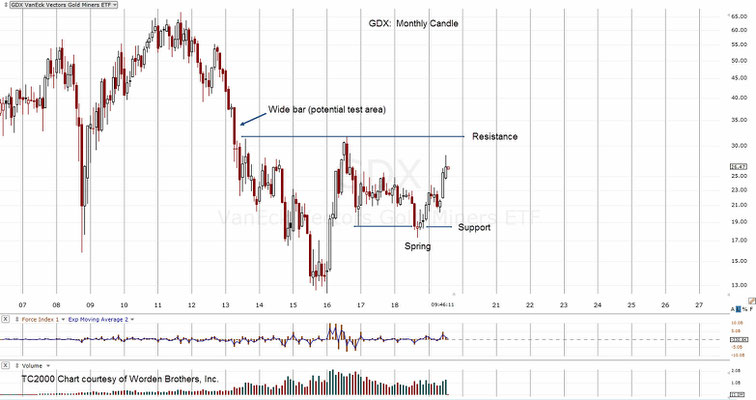
Pulling out to the monthly chart in GDX, we see a slow motion progression from spring to potential up-thrust and possible reversal.
If you know what’s probable on a long term basis, then affairs can be planned accordingly.
The senior gold miner index appears to be marching methodically to test the wide bar as shown.
Price action, while short-term bullish looks to be just a corrective move resulting from the multi-year drop from 66.98, in September of 2011, to a low of 12.40, in January of 2016.

7/28/19: Is This It For Gold?
The launch higher in gold appears to have stalled. Will there be a test of the wide price action posted during late June?
The 7-Day Candle chart of GLD shows prior wide bars and their subsequent tests. It’s just natural market behavior to come back (at some future point) for a test of dynamic, high volume areas.
The problem is (for the gold bulls), that if GLD comes back to test, it would move below resistance (now support) and then re-establish that resistance.
That in turn, would solidify an up-thrust condition and portend much lower prices ahead
As sated in prior updates, it’s not gold that’s likely to be the go-to item, it’s food and more specifically, corn.
Here is one link that has good service and prompt (for now) delivery.

7/20/19 Gold Higher, For Now
As the gold bugs approach Nirvana with the recent $100/oz. blip higher, there may be something else … on a massive scale afoot.
Pulling out to the quarterly chart, we see typical market behavior. There was a huge bull market from 2001 (or so), to 2011. That top covered approximately two years before heading decisively lower.
Markets usually test wide, high volume areas. On a long-term scale, that’s what appears to be taking place.
With recent upward action, the wide quarterly bar from mid-2013, is being tested.
What comes next is the important part
There’s a lot more trading action to come in the current quarter. However, if there’s little upward progress on a go-forward basis, then gold (GLD) might be forming an up-thrust with potential for another leg down … possibly to the $550, area.
What about hyper inflation? Aren’t we there now? Isn’t the dollar virtually worthless?
It’s possible that corn, wheat, and other commodities are going to be worth more than gold (for a while) in the near future … more on that later.
In the meantime, it’s probably a good idea to review Genesis 41 – 47 (KJV). Just one of many (recent) supporting links is here. Remember the ammunition panic in 2008, after the Presidential election? a $12.95 box of .45 ACP, went to $55.00, if you could find it.
Side note: Ammunition, when properly stored can keep its value and last 50 - 70 years or more.

6/30/19: Senior Mining Sector at Up-thrust?
The price of gold (GLD) is higher and yet the senior mining index, GDX (along with the juniors) is lower.
If gold reverses from here, the entire mining ‘space’ may be in serious trouble … as if it’s not already.
The prior GDX sequencing from spring to up-thrust is clear. Now the sector may be at another pivot point.
As indicated in the 6/17/19 update, the juniors look to be the most susceptible to lower prices.
- High volume leveraged inverse funds for this sector are: DUST and JDST
Note: JDST was traded at the GLD danger point from June 14th to the 18th. The trade was exited during the pre-market session on the 18th for a minor, nine-tenths (0.92) point loss (includes commissions).
Charts by StockCharts

6/17/19: Gold Reversal
Gold (GLD) is posting nearly textbook conditions for a reversal.
There was a failed attempt (last week) to make and hold new highs. The weekly MACD may be diverging; The possibility for such an event was covered in the 4/24/19 update.
We’re now at the danger point where price action can go either way. This is the point where risk is least.
Within the gold sector, the most vulnerable to lower prices may be the junior miners, GDXJ.
JDST is the leveraged inverse fund for that sector.
Charts by StockCharts

5/1/19
Targeting Silver (SLV) to $11/oz.
We’ll let the chart speak for itself.
The attached link is a presentation on “why” silver will move higher; the arguments are all fundamental(s) with no charts on what silver is actually doing.
At this point SLV has broken lower out of a wedge, tested that breakout and is now moving (albeit drifting) lower.
It’s interesting that both the Fibonacci projection taken from the April, 2011 highs, and the measured move out of the wedge coincide.
Silver at $11/oz. is lower than (projected) production costs of First Majestic Silver (AG) for 2020. What’s going to happen to its stock price if/when silver reaches that level?

5/9/19
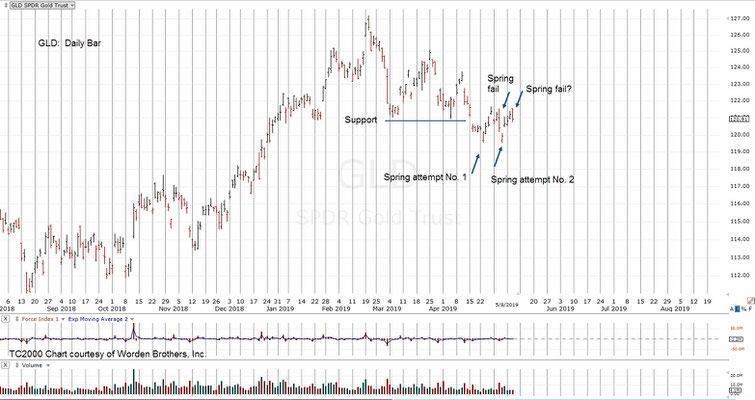
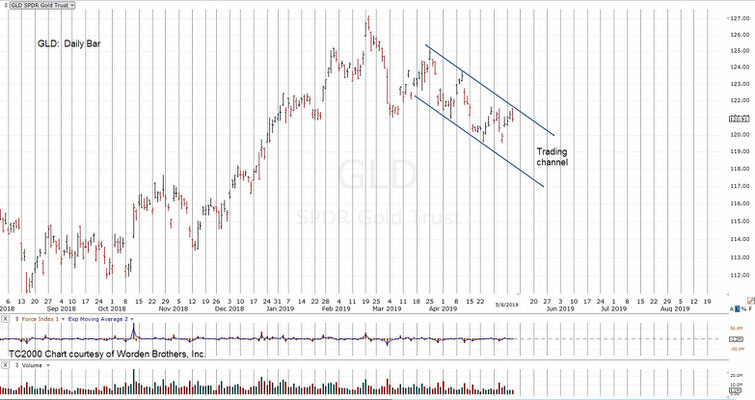
Gold: First Rally Fails, And Now The Second?
There has been one attempt at a spring in gold and one failure. Now, we have another spring attempt as shown on the chart.
When a scenario does not work out as expected, something else is happening.
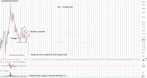
Two charts of GLD, provided here.
The first chart shows the analysis above. The second chart shows another view.
Are we in a bullish set-up, a trading channel or both?
5/9/19: Gold (GLD) Update

5/7/19
Gold Set-Up
Looks like gold (GLD) is set to have some kind of rally. The character of the spring set-up is more labored than previous action so it may not be as dynamic.
Note how long price has remained below support; about four times as long as prior moves.
5/5/19
Silver To Single Digits?
Back in the old days with Middle East tensions rising, gold and silver would be trading in a brisk bull market or at panic levels.
We'll see what happens at the open on Monday. If you want to check silver futures markets opening late Sunday, click here.
Meanwhile, here’s another potential (not a forecast) for silver. The last update showed a breakout from a wedge that’s actually within another, larger wedge.
5/1/19
Targeting Silver (SLV) to $11/oz.
We’ll let the chart speak for itself.
The attached link is a presentation on “why” silver will move higher; the arguments are all fundamental(s) with no charts on what silver is actually doing.
At this point SLV has broken lower out of a wedge, tested that breakout and is now moving (albeit drifting) lower.
It’s interesting that both the Fibonacci projection taken from the April, 2011 highs, and the measured move out of the wedge coincide.
Silver at $11/oz. is lower than (projected) production costs of First Majestic Silver (AG) for 2020. What’s going to happen to its stock price if/when silver reaches that level?

4/24/19
Gold trade still viable?
The short answer is yes. The long answer is we’re probably not going to trade the upside.
The weekly chart of GLD has it in spring position. However, if there is a move higher and if that move reaches new highs, there’s a possibility a bearish MACD divergence will be created.
Note the previous bearish divergence on the chart. The result was a huge move in GLD; a collapse of 18 – 24 points depending on the point of measurement.
During that move, GDX was shorted using a series of put options. A detail of that trade is here.
If GLD moves higher, what’s more likely from my firm’s standpoint, is to monitor price action and observe the behavior if/when there is a breakout to new weekly or monthly highs.
Charts by StockCharts

4/22/19
Pre-Market Gold
GLD is trading higher in the pre-market session and validating the spring set‑up. Currently, we’re at 120.79 (+0.35%) which puts GLD above the highs of the past three sessions.
Price action still remains below the 121-resistance area. However, we may be at the point to expect a rally above this resistance and potentially move sharply higher.
Charts by StockCharts

4/20/19
Gold Higher?
Gold (GLD) has penetrated support and stopped dead.
We’re at the danger point
There's also a wedge pattern as shown. If this pattern is in-effect (viable) and GLD rallies from here, the measured move is in the vicinity of 130; or approximately $1,375 in the spot market.
Charts by StockCharts