

12/26/16: "Quid est Veritas?"
Now we have “The Ministry of Truth”
Try going to any mainstream brokerage firm’s website and access their current market assessment … whether it’s a written report or a recent video.
If you have not done so already after reading or viewing that information, change the dates, ticker symbols and the Fed chairman’s name and see if you could not create a near identical report from 15 or 20 years ago.
Try it, you’ll probably be shocked … then disappointed as you find nothing from these firms has changed in decades. It’s the same old 60% bonds, 40% stocks with maybe the latest fad of "dynamic portfolio re-balancing" or “Smart Beta” thrown in.
However, their game of enforced mediocrity may be coming to an end. As they continue to use data that’s less and less accurate and potentially completely false, the possibility of huge position (market stance) blunders increases. For example, a typical brokerage firm may opine recent unemployment numbers shows us below 5%.
Is that the truth?
No: Unemployment is actually already at or above depression era levels, standing at 22% or higher … not 5% or less.
Robert Prechter, in his book “Conquer the Crash”, predicted the next bear market (that we’re already in) will decimate these firms right along with their clients. Just like Venezuela, there will be two classes: The wealthy and the poor … with maybe a few fragments of middle class left over.
I have friends that are educated professionals. They have watched our research for years. They have seen our correct market calls that are to the day if not the hour.
Intellectually, they see price movement has nothing to do with fundamentals. It’s been proved over and over.
And yet, when I have discussions with them on the market, they continue to quote ‘official’ numbers. For them, breaking away from the propaganda has proved to be impossible. Doing so puts one out on the edge where your performance may look like a genius one day, or idiot the next.
Personally, in my near half-century of experience, 99.999% of the population can’t handle that level of exposure. If you’ve been (or are) in a profession such as a surgeon, flight test pilot (engineer), military Special Forces commander, race car driver and the like, then you know of what we speak. You’re only as good as your last performance … and that was just minutes or seconds ago.
So, how can a mainstream corporate brokerage or money management firm even have a chance at getting it right consistently? More so now that finding accurate ‘official’ data will be next to impossible.
What are they going to tell their clients? That they do not use official numbers for their calculations? Will those (average investor) clients maintain their accounts with such a firm?
However, there's an irrefutable truth in the markets and it does not come from sanctioned sources, but from itself: That truth is the tape …. only the tape.
As the disinformation increases, our objective is, and will be to:
“Drill [ourselves] into the right mental attitude: to stifle [our] emotions, such as fear, anxiety, elation, recklessness; to train [one’s] mind into obedience so that it recognizes but one [market] master – the tape”: Wyckoff, 1910
The truth is in the tape. Read it effectively, and that's all that’s required.
Wyckoff quote used with permission from Cosimo Classics

Pivot-Points: 1/21/16
Pro-log:
In our view, the necessary conditions for another market “dislocation” or Flash Crash are now in place.
My thanks go to Ryan Carlson former pit trader at www.tradingpithistory.com and to Vicki Semersky (Assistant to Andrew Waldock) at www.commodityandderivativeadv.com for their answers and input to my queries.
Note: In no way do the following report statements indicate those listed above are of the same opinion as to what is presented below. They neither agreed nor disagreed. They did not provide, nor were they asked for a market assessment. I was fortunate to receive their expert input on short notice.
The analysis and statements listed below are our own: Three Ten Trading, LLC www.ten-trading.com
Prices Are Not What They Seem:
In this time of fomented markets that are devoid of natural and real price discovery, to think that we are not going to have another dislocation (or a series of them), is to not approach one’s market stance in a realistic fashion.
The question is not if, but when and how many.
How can those statements of price discovery be justified? How can we justify that current prices are disconnected from market reality and do not represent actual values?
Well, unlike the engineering and scientific fields … justifications for market movements come out afterwards and not before. This counter-intuitive fact was detailed by both Livermore and Wyckoff nearly a century ago: ‘Reasons for a move always come out after the fact.’
So it is with current price discovery. Only after prices have penetrated the 2009 lows (our forecast), will the full reasons for such a move be apparent. That is how money is made and lost in the markets.
Of course, there is no guarantee or assurance that we will penetrate the 2009 lows. Such a move (taking place within a few months) would be unprecedented. However, keep in mind that we are already within unprecedented events: Both leading up to the high on May 20th last year and to the downdraft that began the New Year 2016.
The media with its daily connect‑the‑dots approach happily caters to those that seek reasons for a move. That is a very simple requirement to fill. Indeed, it sells a lot of air‑time.
As always, the hard part is to identify what is likely to happen next … which brings us to the Flash Crash of 2010.
What Has Gone Before:
Taking it in overall market context, the 2010 crash was a “microburst” event in the midst of a rising market.
Different from today where the bull‑market is decidedly over; we are now in a downward trend. The next event is not likely to be a burst, but a market broad‑side that may not recover.
The 2010 crash did not come out of thin air but was built up over the trading day and finally unleashed between 2:00 p.m., and 2:45 p.m. EST with the most intense part (as shown on the video link below) taking place in the span of about five minutes.
Here is a link to what may be the best example of the crash as it happened. The voice calling the plays from the pit is that of Ben Lichtenstein, Tradersaudio.com (now available from www.thinkorswim.com)
The audio starts with him describing huge “paper” sellers coming into the market. ‘Paper’ is essentially anyone (banks, hedge-funds, institutions, and/or retail) outside the pit. Those in the pit are called “locals”.
We can clearly see and hear the crash being a series of events. Possibly most important is that the crash happened after the market had a significant decline.
The market crashed after it was already way oversold.
Manipulation In The Early 1900s
In his autobiography and other writings, Richard D. Wyckoff states that when a market manipulator was attempting to move a stock to a particular (lower) level for accumulation, that operator must take care to not push the stock too low as it would induce further selling.
It was an art form. Push the price to a low level for accumulation without bringing in unwanted selling.
Whether or not the S&P was being manipulated lower on May 6th of 2010, is not important for our discussion. What is important is that we can see the same dynamics at work over a century later. Nothing has changed. Price action was pushed just a bit too low and further, unwanted selling came in.
The Market Is Ready
In the current environment, and until proven otherwise, the bull market is over.
Some will debate that it was on May 20th of 2015; others on August 24th and still others at the counter‑trend high on November 3rd as reported by our firm (see this link).
No matter, the bull is over and we are in a bear market phase of subdividing lower. Surprises will most likely be to the downside.
As stated at the introduction, real price discovery has been suspended for some time (seven-to-twenty years depending on whom you ask) by manipulation and intervention.
Therefore, the current market is riding aloft on what amounts to “bottled air” to borrow a quote from David Stockman www.davidstockmanscontracorner.com
Well, so what? Markets can ride aloft on such delusion for extended periods. What makes this time any more significant?
The Catalyst: Hedge Funds
Just yesterday (1/20/16), a Bloomberg report (at this link) stated that over the past several weeks, hedge funds have been significant buyers during the market decline. They have essentially been buying the dip in anticipation of price recovery to the upside.
It has already been long ago reported that hedge funds are essentially exhibiting herd mentality. This article about the “hedge fund hotel” indicates that those funds are executing similar strategies with the same equities … operating essentially in unison. Not all, obviously, but enough.
What will happen if the anticipated bounce does not materialize? Potentially, there is a large amount of downside energy built up with long (hedge fund) positions that are now, or soon to be in the red.
The S&P 500: Critical Condition
Unlike the S&P of the past that would retrace 50% of its moves on a regular basis, the current market is exhibiting the unusual characteristic of only retracing 23.6% of its downward thrusts.
In our experience, a 50% retrace was common and typical. A 38% retrace was rare … but 23.6%? We do not recall ever having seen consistent S&P behavior with such weak counter-trend moves.
That is where we are now. The market subdivided lower on 1/20/16, and penetrated lows not seen since April of 2014. Today’s session has stalled at the 23.6% location and is now eroding lower.
The potential for ‘dislocation’ may grow quickly if the market begins to threaten its nascent reversal, fails to follow through to the upside and begins to decline back to the April ’14 lows.
Respectfully submitted, 3:10 p.m EST
Paul V. Mosgovoy

Pivot-Points: 1/8/16
We just had an unprecedented market event with the Fibonacci contraction of the S&P.
Now, we just had the worst four‑day start of the year in history.
So, that must be a buy signal … right?
Right about now is a good time to revisit the 2010 “Flash Crash”.
The video at this link is to a running commentary by Ben Lichtenstein who was providing an audio squawk box service for traders.
Our office has been in contact with several former S&P pit traders to get more information on the event. Those results will be posted at a later date which may be as soon as this weekend or early next week.
Listen to the recording and then multiply it by 2, 3, or 4 times and we have a better picture of what may be in store.
The point is, this down move could be of Biblical proportions. That assessment was detailed well in advance of current conditions via the “Appointed Place”
So, here we are. Experiencing market events one after another which have never happened before.
What happens next may also be for the record books.
Buy signal?
Paul V. Mosgovoy
Posted: 8:54 a.m. EST

Pivot-Points: 1/2/16
The big money is in the big move.
That fact has not changed since May 17th, 1792, the inception of the New York Exchange.
Our office at Three Ten is not interested in flitting about, tweeting, posting and opining incessantly about the latest news release. We are not hoodwinked by investment fads such as “Smart Beta”.
We are not interested in narrowly focused arbitrage methods or a-biotic system methods such as Algorithmic trading.
In the late 1980s, Algorithmic trading had a different name: It was called computer driven “program trading”. Program trading was called out as one of the prime factors exacerbating the crash of 1987. Something to consider in today’s environment.
No. Behind those frenetic actions of the continuously distracted, or those who are bending down to snatch pennies in front of dollars; we are busy identifying, positioning and then working to full conclusion opportunities that may provide a powerful, sustainable move.
After identifying an opportunity, we begin the positioning process. That process may take weeks if not months for us to complete.
At the same time, we have to be ever vigilant of changing market conditions. The anticipated move may initiate sooner than expected. It may fade out all together. Flexibility is a requirement.
If properly identified and if the market co-operates, those opportunities may last for months or even years until completion.
Back to today: In the New Year 2016, the S&P 500 (and the sub-markets) are poised to initiate one of the largest moves in history.
That move may indeed come to fruition. It may happen sooner, later, or not at all (the least likely scenario in our view).
No matter the market outcome. Our objective remains: Identify the opportunity, position accordingly and manage appropriately.
Respectfully submitted,
Paul V. Mosgovoy
Pivot-Points: 12/31/15
For those who are members or visitors to this website, you are part of a select enclave.
The metrics for the past year are as follows:
Total number of site visits: 1,700
Total number of page reads: 13,070
It is not site visits or page reads that are the driver for presenting our research.
If it were, I would have spent wasted hours on sites such as LinkedIn or Seeking Alpha attempting to tout (to a deaf, dumb and blind crowd) the virtues of market techniques that are a century old.
To be fair, I have found worthwhile information on those sites (kudos to you, Nathan), but the effort of sifting through so much pedantry to get to a nugget of gold, is just not worth the time. Not worth the time for anyone, I would suggest.
No. The purpose of this site is to first, stay on top of our game at Three Ten. We do this by presenting in a flight-test briefing format if you will, the distillation of market information and technical analysis into an actionable plan.
There are excellent sites like Stockman’s Contra Corner that post data on what is happening. There are very few however, that can take the next step and consistently determine that “today is the day”.
At the crux, that is our objective. Is it today or not? Is the action plan, the trading plan still viable or not?
Thank you to the contributors and consultants to this site; Congratulations and thanks to those who continue to access what we think is a distillation of research that is a rare find in the market arena.
Best wishes for 2016,
Paul V. Mosgovoy

Pivot-Points: 12/18/15
There have been other times in market history where valuations were stretched and interest rates began to rise. One such time was 1987.
Let’s review the market conditions of that period and specifically, October 16th 1987 as seen by the late Dr. Martin Zweig.
It is an excellent display of technical acumen and market history.
Notice Louis Rukeyser’s list of concerns at the beginning of the segment:
- The market had not sold off more than 10% for nearly three years
- Interest rates are moving up
- Jitters over new incidents in the Persian Gulf
- Political situation … “scarcely encouraging” … with leadership problems and tax increases on the horizon
- “Mindless computer program trading”
However this time around, unlike 1987, we are not in an economic expansion. Economies world-wide are going off the cliff.
That economic truth would tend to indicate there will be no significant or sustained rebound once the air starts to come out.
Paul V. Mosgovoy
Three Ten Trading, LLC
Posted: 12:54 p.m. EST
Market Summary:
12/11/15
As this bear market unfolds, it will define its own characteristics.
At the time of this post, we can see the S&P attempting to close the opening gap while Basic Materials is making no such attempt. It has opened gap-down, is heading down and may be reasserting its downside leadership.
As expected, the move in DOW, and DD this past week gave the professionals the liquidity event that allowed huge low-risk short positions to be established.
Now that positioning is complete, the price is allowed to fall away under its own weight. This is supposition of course but the behavior is not much different than what Livermore and Wyckoff observed at such junctures a century ago.
If it were not true, then as stated previously, DOW would rise effortlessly to new highs and bring the rest of the sector along with it. Obviously, that is not the case.
Over 63-Million shares were traded in DOW this past Wednesday (12/9/15).
That is the second highest volume since the crisis of 2008 - 2009 and the fourth highest volume ever for the stock.
Volume like that means there has been a significant changing of hands; from weak to strong.
Paul V. Mosgovoy
Three Ten Trading, LLC
Posted: 11:11 a.m. EST

Market Summary:
12/4/15
“There is a tide in the affairs of men.
Which, taken at the flood, leads on to fortune;
Omitted, all the voyage of their life
Is bound in shallows and in miseries.”
Brutus: Shakespeare’s Julius Cesar, circa 1599
In this day and time and at this point in market history, we are at the flood.
The big money is in the big move; and the big move is down.
The S&P 500 topped in May of this year. It traded sideways until August where it broke decisively lower and drove the VIX to its fastest one month rise ever recorded.
This volatility move (in the VIX) was unprecedented: Effectively and decisively breaking the upward stride of the six year bull market.
While the market appeared poised for an immediate crash … miraculously it launched into a corrective a-b-c rally that took it to within 1% of the May high.
A quick and brief decline ensued but was then followed by another rally … this one weaker, shorter than the previous.
It too has topped and reversed.
The bull is over and we are now subdividing lower: The market made a lower-low in August and successive lower-highs; one in November and one in December.
As a corollary to all of this action, we are at a juncture where current levels are completely disconnected from free market price discovery and reliable (unadulterated) financial basis.
There is a value point somewhere but it probably lies well below the 2009 lows.
We are at the end of a multi decade’s long financial experiment Such opportunities are not only rare, they are historic in nature and come only once in several generations.
Continuing on and ending with Brutus:
On such a full sea we are now afloat,
And we must take the current when it serves,
Or lose our ventures.
Paul V. Mosgovoy
Three Ten Trading, LLC
References:
VIX posts extreme: Fastest one month rise ever
Eliades interview: A generational high
Why this sucker is going down again: The experiment comes to an end
A-B-C corrective rally to test the high: Corrective phases complete

Market Summary: 11/27/15
The markets tend to reverse when all are asleep: Just prior, during, or just after a holiday week.
The following is a short list of (holiday) reversals and their subsequent declines:
- Week of 5/23/08: S&P 500 makes a high on the Monday prior to Memorial Day and then crashes over 53%
- Week of 7/3/14: Russell 2000 makes a high on the Tuesday of the July 4th week and subsequently declines 9%
- Week of 9/5/14: Russell 2000 makes a high on the Wednesday after the Labor Day weekend and then declines 12%
- Week of 6/26/15: Russell 2000 makes a high on the Wednesday prior to the July 4th week and then declines 17%
-
Week of 11/23/15: The S&P 500 attempts to push above the 210.00 level during the Thanksgiving week and apparently stalls. Potential decline is:
Unknown
Paul V. Mosgovoy
Three Ten Trading, LLC

Market Summary: 11/20/15
It’s a skeleton crew and a ghost ship, heading into uncharted waters … with the ever present sage perched at the helm.
The skeleton crew is the so-called FANGs market: Facebook, Amazon, Netflix and Google.
That’s all that remains: The market is thinning out to ever more meager and limited participation.
The ghost ship is what's left of the bull market that started its journey from the 2009 lows.
Uncharted waters: The events about to unfold. The current situation is unprecedented and never before in market history. We are about to experience the full onslaught.
The ever present sage: A metaphor that I choose not to reveal. If you are a student of market history, then you already know.
Notice how the “sage” is not dead and will survive (if not in its current form, it will be another). The crew … well they are already dead and have been left clenching the ship’s helm in rigor-mortis.
Paul V. Mosgovoy
Three Ten Trading, LLC
Posted: 2:02 p.m. EST

Market Summary: 11/13/15
The bear market train has left the station.
As shown in this link, the multi-year uptrend of the S&P has been decisively broken and subsequently tested.
Price action reversed at the Fibonacci time and price location previously identified: See the Market Summary shown immediately below (11/6/15).
We have used the same Fibonacci extension technique to forecast a likely termination point for the nascent down move.
If Fibonacci can forecast on the way up, then it can forecast on the way down.
The Basic Materials sector has begun confirmation of its down channel (Weekly basis, 10/24/15 update) as shown in this link.
The accelerating downside factors for the sector are:
-
Sales lower
-
Earnings lower
-
Layoffs higher
-
Dollar higher
-
Bonds lower
-
Gold lower
What is missing, but sure to come is the unexpected event. We could also get a series of small events in succession. It really does not matter at this point.
Of course if everyone is looking for some kind of catalyst, then in typical market perversity there will be no such event.
Restating the trading plan: The basic materials sector has shown itself to be one of, if not the weakest of the major indices. Adhering to the admonition of the market masters whose techniques are implemented on this site, we are focusing exclusively on that sector.
In Prechter’s book At the Crest of the Tidal Wave (an even better read now, nearly twenty years later) he states to the effect that diversification will not protect your portfolio in this bear market.
He goes on to state that only extreme specificity will offer protection and for those skilled enough, the opportunity for profit.
His statements reflect those of the undisputed market masters: Livermore, Wyckoff and Loeb. Enough said
Paul V. Mosgovoy
Three Ten Trading, LLC
Posted: 10:41 a.m.
EST

Market Summary: 11/6/15
“There is an appointed time for everything. And there is a time for every event under heaven…..”
Time may have just run out on this market.
Tuesday 11/3/15, was indicated as the date where the S&P met both Fibonacci time and price constraints.
When that type of analysis is employed, there is always a leeway of a day or two for confirmation.
However, it appears that Tuesday was indeed the recovery high for the S&P. As we can see, it is now working its way lower.
If the analysis that yielded the 11/3/15, high proved correct, then one must conclude that the rest of the forecast has validity as well.
The complete forecast is here. However, the distilled version is for a decline of such proportions that the market direction (and economic implications) will be unmistakable.
Paul V. Mosgovoy
Three Ten Trading, LLC
Posted: 11:15 a.m. EST
Market Summary: 10/31/15
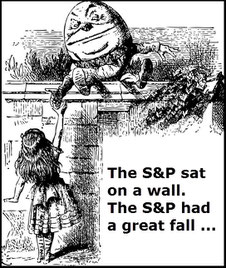
… and all the king’s horses and all the king’s men could not put the S&P back together again.
The market has stalled.
A recent article at this link indicates that even after stimulus, Eurozone inflation is at … Zero.
The chart analysis of the S&P shows that it has been hovering around a Fibonacci extension level for several days and has now reversed.
Whether the market will slowly and haltingly ratchet its way lower or gaps successively lower remains to be seen.
One thing appears to be certain: No one can put this market back together again.
Paul V. Mosgovoy
Three Ten Trading, LLC

Market Summary: 10/23/15
The August 24th market low was so chaotic with delays and halts in trading that I was reluctant to use that data point for any type of technical analysis. Looks like I was wrong.
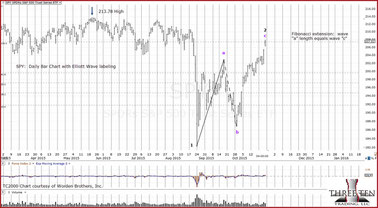
We can see from the chart below that this session’s high corresponds with a Fibonacci extension taken from that August 24th low.
It is difficult to not be dramatic about the potential danger.
If (and it’s a big “If”) we are in the process of completing an “a-b-c” correction, the overall market may be headed for a decline that will rival anything anyone reading this text has ever seen.
In Elliott Wave parlance, we had a “Wave 1” down from the May 20th high to the August 24th low. Then, an a-b-c correction into a “Wave 2” top that may be at hand. If so, the whole market is ready to turn lower into a “Wave 3”
Wave 3 is where everyone realizes that the true direction of trend is down.
For the above analysis to be correct, the market (S&P) would need to reverse from this point forward.
The alternative would appear to be a levitation of the index to new highs. We all should be well aware by now that the markets abandoned any kind of actual price discovery and semblance of the underlying value years ago.
Anything can happen.
Paul V. Mosgovoy
Three Ten Trading, LLC

Market Summary: 10/16/15
It’s like a Mexican standoff.
Everyone with six-guns drawn, staring at each other in anticipation. Thumb on the hammer… pulling it back… just waiting for that distinctive “click”.
Once we hear that click, it’s over. Guns blazing and when the smoke clears we’ll see who is left standing.
With data like this coming in, the potential for an unforeseen event that leads to a market melt-down is loaded in. Not if, but when:
- CBOE Skew indicates crash expected
- Pavlov conditioning for failure
- Bond “event” may cause equity wipe-out
- Blackrock Rules
- Carl Icahn video
Those with means have prepared and continue to prepare for the inevitable. As sated in prior updates, laws and rules have been enacted to make sure that the public foots the bill for a catastrophic banking or market event.
Carl Icahn put it well in his video (time stamp: 13:41) that we may find ourselves looking back at times like ’87, ‘01, ‘08 and think those were the good old days.
Basic Materials has the short squeeze at an extreme; pushing into well established resistance. Gold at an up-thrust pivot point and the dollar index in a spring set-up; poised to move higher.
Conditions have now reached the state where there is so much riding on a rising market. The big players have effectively surrounded each other; glaring, staring with guns drawn and thumb on the hammer.
This trading entity continues to position itself for an event whose exact time is unknown but considers imminent.
Until it arrives, we stay vigilant, manage risk and… wait… what… what’s that?
I thought I heard something.
Did you hear anything?
“click”
Paul V. Mosgovoy
Three Ten Trading, LLC

Market Summary: 10/9/15
Late in 1906, Jesse Livermore determined the market was going to crash.
His 1923 memoir provides a few capital draining fundamentals such as the expense of the Boer war by the British and the San Francisco earthquake which resulted in considerable stress on the railroads.
His notes focus not necessarily on the fundamentals of the time, but more importantly his accurate assessment of conditions and his subsequent response.
It’s a story of frustration: Going short, covering, going short again, and covering again … ultimately being busted out of the market on a last sharp rally before the major decline ever got underway.
He could see in his mind the ultimate (crash) result but was not prepared for all the market gyrations that occurred in the interim.
Note: The market action of 1907 is not that different from today. Over the past two weeks, the market has rallied sharply. When a rally like this happens in a bear market, it is typically a short-covering affair.
Continuing with Livermore: Several paragraphs later he discusses getting started again (on the short side) at Ed Harding’s brokerage.
Nowhere in this section or others, does Livermore say where he got the additional capital to trade. I was always curious about this event and wondered how he managed to restart his trading account.
The answer to that question surfaced later when I came across Wyckoff’s work, published in 1910: Studies in Tape Reading.
In that text, Wyckoff reveals that Livermore pawned his car for $5,000. Obviously he (Livermore) used that capital to begin again: Question answered.
Confident that there was going to be a collapse, being whacked several times and then out altogether, Livermore did whatever was necessary to get back in the market.
Ultimately he was on the right side of the trade and spent the next six months or so going short and using the increased margin to add to the short line.
Livermore covered the entire position on October 24th 1907: His profits from the short campaign were over a million dollars. That was back when money looked like this … sigh
Livermore saw the big picture: The huge move that was yet to arrive.
Now we come to the events of today.
Let’s take a look at some of the fundamentals that surround the current market environment:
- Increased international tensions world wide; any of which could go flash-point at any time
- Deutsche Bank troubles that may involve its huge derivative exposure
- Brazil economy in collapse, bringing down DuPont (DD) and others
- China: Who knows what is really going on behind the kimono … with paddy wagons arresting short sellers, it can’t be good
- The U.S. economy never did recover and is not recovering now. Inventory‑to‑sales ratio is widening. Consumer debt is stratospheric. There has been, and will be no “consumer” led recovery
- Real estate is in yet another bubble with this one surpassing previous bubble levels
- Corporate stock buy-backs are not the investment actions of managements from times gone by … they have become perverse
- U.S. markets have been following a 7-year cycle since 1972. Down is now
- There is no real market price discovery anymore. The actual (true) value of the corporations that trade is far below current levels (somewhere around 50% - 70% below is a reasonable estimate).
Notwithstanding the fabricated market prices, the market actions of today are similar to those described by Livermore years ago.
One of our strategy consultants has an opposing view and thinks that the U.S. markets will just “muddle through” similar to Japan’s lost decade.
It is a valid point and was discussed at length during the week just ended.
Holding to the theory of market alternation; that what happened the last time will not happen this time, the U.S. markets are not likely to get the option to muddle through.
That market event has already been taken by Japan.
We now alternate to the other market alternative … swift, steady, sharp bear market (or something even more direct).
Not that much different from 1907
Paul V. Mosgovoy
Three Ten Trading, LLC

Market Summary: 10/2/15
“We don’t buy pizzas for engineers.”
That is what the accountant told me when I submitted my expense report.
I was attempting to get reimbursed for feeding a team of engineers that had been working late hours during an autopilot certification program.
Late hours meant the pizzas showed up in the engineering lab somewhere around 8:30 p.m. The team still had many hours to go for that night and the pizzas were a much needed reprieve.
Keep in mind that over the preceding weeks these same engineers had already racked up hundreds of hours equating to thousands of dollars of un-paid overtime.
So, instead of drawing attention to their un-paid plight, as their manager, I attempted to deflect the issue and at least offer up a pizza or two.
However, it is the mindset of the accountant that is important in this story. It typifies the mindset of the masses: The “public” as Livermore called them.
That accountant was going to make sure that no engineer ever got a ‘free’ pizza.
Never mind that those same engineers were the ones responsible for designing and producing the very product that enabled the accountant to receive a salary.
It is this same limited mind that pervades the marketplace. How is someone that is so focused on something so small going to be able to grasp that they are living during an unprecedented time in world history?
If they can’t deal with the abstractness that a $9.95 pizza saves about $5,000 in paid‑overtime, then how will they ever manage the surreal market complexity of today?
In his writings, Prechter points out that in the coming major bear market, there is one segment of society that will be completely wiped-out. It’s obvious that the middle class may already be in the process of losing it all.
As brokerage accounts become decimated, layoffs increase and joblessness rises, that very same accountant noted above might find himself at a shelter one day receiving a free meal.
Making his way through the food line with the other homeless, he comes upon a pizza. Looking over the counter at the volunteer dishing out slices, he recognizes a former co-worker: The engineer
Paul V. Mosgovoy
Three Ten Trading, LLC

Market Summary: 9/25/15
“Smoke in the Cockpit”
Those words typically preceded an in-flight emergency and a forced landing (if you made it that far).
During my time as avionics system integration Lead Engineer on Global Express, smoke in the cockpit occurred ‘only’ one time. In a critical situation, recognizing what is taking place is important. However, even more important is the response from the pilot in command.
In the case above, the pilot (Pete Reynolds) was likely under extreme stress.
The aircraft was at altitude with no quick way of getting to safety. Even so, there was no outward indication of duress. All the flight test log said was “Smoke in the Cockpit”.
The situation was assessed, the smoking unit identified and the circuit breaker pulled. Smoke cleared, there were no aircraft system warnings or alarms. The flight test continued.
De-briefing of this event in a room overflowing with engineers and pilots had a dual effect.
There was of course, a burnt computer that would be addressed swiftly. At the same time, those in de-brief were witnessing that Reynolds was setting the standard.
That implied standard was something to the effect of: You’ve got to have a really good reason for aborting, cancelling or modifying a flight test that is costing a minimum of $10,000/hour.
What does having cajones the size of cantaloupe have to do with the market situation at hand?
Well, the S&P 500 has smoke coming out and it's likely to burst into full flame. Unlike the avionics computer above, we are not able to just turn off the S&P. It has to burn itself out: That my friends could take a long ... long time.
From a trading or positioning standpoint, the situation requires a calm assessment and appropriate action.
One of, if not the weakest sector(s) has been identified as Basic Materials. Virtually no one is paying any attention (as evidenced by the low volume in SMN). It’s a boring sector. What excitement could it possibly hold?
Well, we do not have to go looking for trouble. Trouble will find us sure enough.
When it does, the market position (SMN) is structured to take full advantage of the potential smoke.
Paul V. Mosgovoy
Three Ten Trading, LLC

Market Summary: 9/18/15
During a market strategy session this week, one of our industry consultants (from oil and gas) remarked on the news events of the week.
His comments centered on the confusion of the pundits and that their advice seemed to be dictated by the current market direction.
If the market was down, it was China, Europe and Japan. If the market was up, it was employment numbers look good.
These prognostications changed each day (up, down, bad, good) and sometimes several times during the day. I commented that there is nothing even resembling some kind of effective market
strategy being discussed.
Something like that would require the discipline to implement a plan based on technical market conditions and not on news or press releases. Thinking about this situation prompted a visit
to this link.
That link contains a simile of the following market participants.
- The average investor
- Average investor’s brokerage account
- Market pundits and media
- The average investor who has just decided to rise above the mire of mediocrity
- Professional speculator or strategist
- The red herring
- Market consultant
- The contrarian
The Average Investor
The Blind Man: He may be part of the overall scheme but you notice that the professionals (the thieves) take off without him. He may get his take of the loot or maybe not.
Average Investor’s Brokerage Account
The Bank: Constantly under attack by the professionals.
The Pundits
Clouseau: Stumbling, bumbling and following the direction of the day.
The Average Investor attempting to rise above
Bank Manager: He represents the average investor that has just decided he has had enough of the propaganda. He thus takes his market training and brokerage account into his own hands. He is promptly whacked by the pundits (as he continues to listen to them). They serve to keep him off balance and questioning his own methods.
The Professionals
As stated, they are the thieves: They know what they want, where it is and what it takes to get it. However, it is not quite that ruthless. If the average investor did not put
his money in a brokerage account and “invest”, there would be no funds available to the professional.
Red Herring
The Woman: A complete distraction not related to the situation at hand. She is seen in white, walking across the street: Time stamp 2:01.
The Market Consultant
The Monkey: He stays close to the average investor and attempts to help and warn of danger (monkey knocking on the window). However, as long as average stays that way, there is little
hope of accomplishing much.
The Contrarian
Clouseau’s supervisor: Sharp, direct and asking the hard questions. He continues to be amazed at the idiocy that
infests the system. If he can’t come to some kind of acceptance of this (never ending) fact, he is banished to the asylum.
Paul V. Mosgovoy
Three Ten Trading, LLC

Market Summary:
9/11/15
Maybe if we ignore it ... it will all go away.
The following are just some of several links (potentially some of many) that are available if one wants to ignore the current market situation.
-
http://www.newsmax.com/Finance/StreetTalk/Mario-Gabelli-stock-market-investors-economy/2015/09/08/id/678578/
-
http://www.schwab.com/public/schwab/nn/articles/Schwab-s-Perspective-on-Recent-Market-Volatility
-
http://www.cnbc.com/2015/09/09/market-volatility-is-bad-for-your-health-commentary.html
-
http://www.marketwatch.com/story/leon-cooperman-says-blame-the-machines-for-market-volatility-2015-09-08
Of course if and when the market gets to the "holy-grail 20%" decline, then it will be labeled a bear market. At that point, something must be done.
In reality, something should have been done well before 20% down.
If and when that happens, the pundits will act like we should have known it all along. This type of behavior has been going on since the beginning of the markets themselves.
Meanwhile, whether or not this is a kick-off to a new bear may be determined soon enough.
The chart below shows where 92% of the current short positions in the POC account were established before the break.

While the press and the average investor duke it out with the professionals, we can see that this activity is taking place well below the short-entry points.
This is just as Livermore stated in 1923. Establish your position profitably and then it can withstand the inevitable onslaughts that will come against the trend.
So, we wait. There is most likely going to be volatility coming up: Maintaining positions unless stopped-out.
Paul V. Mosgovoy
Three Ten Trading, LLC

Market Summary:
9/4/15
Several years ago, I had the great fortune of being mentored by David Weis.
It was the culmination of a years-long goal to get a snippet of time from an undisputed market master.
Before I ever sent him my e-mail request, I scoured for every detail that I could find on his method of research. In addition to articles that he had published in Stocks & Commodities Magazine, he also produced a video in conjunction with Dr. Alexander Elder in 2007.
I memorized his sections of the video. I listened for voice inflections and hidden nuances in the analysis that he was presenting. Not that he was hiding anything: To the contrary, when you have decades upon decades of experience such as he did, there are just some things that one knows internally and communicates non-verbally.
After I sent my e-mail request where I included a poorly analyzed (although just how poor was not apparent to me until later) “spring” condition on a stock, he responded that he was available.
This all happened before he introduced his ‘wave’ software for widespread purchase and just before the launch of his website. It became apparent mid-way though our mentoring sessions that he was beginning to be under significant time constraints. He would not have have been available if I had shown up just a few weeks later.
The difference in Weis as opposed to others, was that he emulates the masters of old like Livermore and Wyckoff. In his video and during our sessions, he talked of the “abstract” and that reading the bar charts is not a trivial task or one-time event. The markets are in constant flux.
Those ‘abstract’ comments by him stuck with me over the years. I have found that thinking about a situation in a seemingly convoluted way, may yield a surprising or useful insight.
All of this now brings us up to date and to the market at hand: Real estate. We are using the IYR ETF as the proxy and already have a profitable position established.
If we look at the chart of IYR in a typical way, we see a reversal that has a break-away gap (from 8/24/15) and then subsequent high volatility.
The high volatility makes IYR look unstable or potentially indecipherable. However, if we enter into the realm of the abstract, compress the price scale, turn the chart up-side down, we get a different picture.

Compressing the scale shows us that the IYR has broken out to the down-side (up-side inverted as shown at left). This breakaway gap has not been filled and does not look like it will ever be filled: A significant event.
Part of this abstract approach is to recognize that an old paradigm has ended: The one of endless market manipulation to the up-side.
This change in market behavior (from up to down) had been in the works for some time but really came into full effect on 8/11/15, with the devaluation of the Yuan.
That does not mean that there will not be violent short and medium term stabs (and trading opportunities) to the upside. It only means that there has been a reversal of market behavior that literally has been in effect since 1971.
If this assessment of change is ultimately proven correct, then it is a watershed event indeed. It would therefore go without saying that the risks to the downside at this point are hard to estimate but probably more significant than anyone would expect.
As Taleb has stated, we are in a world of extremes. Analyzing such a world requires an approach in the abstract.
Paul V. Mosgovoy
Three Ten Trading, LLC

Market Summary: 9/1/15
By definition, the current decline can not look like the previous decline. Markets tend to alternate. What happened the last time will most likely not happen this time.
Conditions and events are different. Market psychology is different. Price action behavior will therefore be different.
We can see the current decline that began in the middle of August does not look like the decline of last October which in turn does not look like the decline from the summer of 2011 and so on.
However, since this current rout may indicate a sustainable reversal from an all time high, we would be well served to go back and look at the decline from the last all time high: 2007.
Already there are differences: A double-top vs. a rounding-top. Additional details are identified at this link.
Another important difference with now vs. the beginning segments of the previous decline from 2007 is that when the SPY is viewed on weekly-close basis, it is essentially going straight-down.
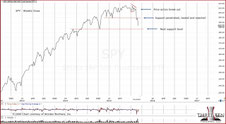
Weekly close chart of SPY shows different price action behavior from previous highs.

Market Summary:
8/28/15
The dominoes begin to fall.
Simultaneous (or near enough) events during the past couple of weeks:
China devalues currency
China devalues currency again
China devalues currency yet again
China dumps U.S. Treasuries
Bonds reverse lower, rates higher
S&P 500 reverses downward
Housing permits spike higher and reverse
Dollar reverses higher
QE 4 rumored
These events may have unintended consequences such as:
Real estate heading lower (again) in part deux
Margin calls on loans collateralized with stock and bond assets
Additional (forced) selling of bonds and equities
Interest rates higher forcing the abandonment of corporate share buy-backs
Corporate earnings move significantly lower
Corporate layoffs
Bankruptcies (already in process for coal and oil)
Livermore stated in his 1923 memoir,
Reminisces of a Stock
Operator, that surprises tend to come in the direction of trend. It is best to be positioned for those surprises.
In Taleb’s work, The Black Swan, one of his conclusions was that when a surprise occurs, it is in the extreme. We are no longer (and never have been in his view) in a world that conforms to the distribution bell curve.
In the past few days, the market had a significant (but not catastrophic) move. In that one day alone, we had stock and ETF trading halted an estimated 1,300 times during the chaotic market open.
During that day at least two brokerage firms had trading platform lock-ups and one brokerage firm suspended trading in its futures department.
Just this morning, another broker does not have an active website altogether … ‘please call back later’.
As mentioned in the Old School post, this activity has been anticipated and incorporated into the trading method.
While being anticipated, it does not mean fully mitigated. There are always unknowns that can not be forecast. The entire market system could experience a failure that takes everyone down with it ... no survivors.
The trading method on this site is what we think best to implement (for this trading entity) taking the above factors into account.
Waiting for the next domino to fall … Surprise!
Paul V. Mosgovoy
Three Ten Trading, LLC
References:

Market Summary:
8/24/15
Our opening moves in this series were to correctly position short in Basic Materials and Real Estate prior to the general break.
The objective from this point, is to allow the markets themselves to define the next appropriate trade action.
Wide, high volume price bars such as we are experiencing during this session are inherently unstable. Therefore, it is possible that there may be continued upside action for the short-term. However, as a result of today’s decisive thrust against the bulls, a complete reversal and decline to lower-lows is the expectation.
As Livermore indicated in his 1923 memoir, now that we have a profitable position, it can withstand the inevitable attacks against the main trend as we sit tight.
As a side note, it is interesting to see that real estate (IYR) made little upward progress during this session and has reversed to finish lower. It appears to be one of, if not the weakest market on a go-forward basis.
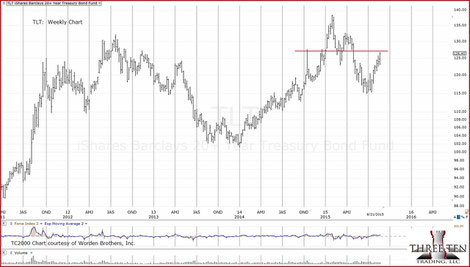
Market Summary: 8/22/15
Although the market thrust lower was fantastic for short positions, the potential
harbinger for what may be coming next (as if this current down-leg was not enough) came from the bond market.
The weekly chart of TLT (proxy for the long bond), shows that it has barely made it back up to test a resistance area from a prior break down.
What is so important about that?
If the market rout just past, is not able to launch the so-called safe haven higher, the potential direction for that market is to lower levels as well.
Higher rates will put the kibosh on a host of economic activity such as corporate share buy-backs, real estate transactions and so on.
The share buy-backs in particular (at all time historic highs, no less) have given the illusion of earnings growth and have been one of the actions propping up the market. This gets us back to the “air-pocket” scenario discussed here.
One of my former engineering managers used to say; “The only reason I keep coming here, is to see what happens next.”
What's next may be a potential corrective rally. After that, we have September and October as seasonally down months.
The probabilities are in favor of continued (potentially dramatic) lower price action in all markets.

Market Summary: 8/13/15
Back in the day when I was living in England, I recall being on the London tube and watching an American tourist couple get on the rail car. You could tell they were American as they had the requisite harried look, plaid pants for the husband and “skorts” for the wife.
By that time, I was fairly well immersed in the Brit culture (including the ability to generate an excellent English accent when needed) and so remained as the Brits do, reserved, withdrawn and with just a hint of down-the-nose disdain.
I could see the husband looking down pensively at the spaghetti-junction tube map in his hand. Before he had a chance to say anything, the wife belted out in her American accent: “Harry, where are we?”
It was entirely reasonable to ask … As for me, I never did figure out how to read the London (or any other city) bus schedule even after living there five years.
I suppose that it could have been one of the Brit’s secret weapons had the Germans ever made it on shore. They would have not known if the bus was coming, going, and when, or if it was going to be green or red (green was country, red was city).
So here we are with a similar situation as we face a spaghetti-junction stock market: Seemingly indecipherable to the tourist, the average investor and/or the media, or both.
Of course, the natives have a pretty good idea of where we are. As mentioned in the “Appointed Place” that is currently on the home page of this site, the professionals are taking up their positions and digging in.
Everyone’s time frame is obviously different. However, as this trading entity adheres to the analysis and techniques established long ago, one of those requirements is to determine what is going to happen in a “big way”.
To address that requirement, we are presenting the following link from David Stockman, the former Director of the Office of Management and Budget for Ronald Reagan.
What Stockman describes is essentially the big picture of where we may be headed. If and when that happens, what it will look like, how far down the market ultimately goes (and the management of such), requires a different type of skill.
Which brings us back to the charts. The one that is presented at this link gives a
technical assessment of where we are and where we might be headed. This assessment is in line with Stockman’s overall conclusion.
The difference is, and as Prechter has often said, a bear market is not just a bull market turned up‑side down.
Bad things happen in bear markets: It’s best not to be a tourist.