
Real Estate
March 4, 2017
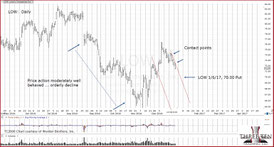
12/28/16: LOW, Put Details
FCX seems to have too much buoyancy for comfort. Thus, another trade was located. The Put on LOW plays into the bearish real estate thesis.
Note the prior down move where price action was somewhat orderly. There were a couple of smooth down bars (in September) but overall, not all that dynamic.
Rule of alternation says the next move is likely to be swift.
12/21/16: IYR

12/14/16: Next Up, Real Estate
Housing data comes out on Thursday and Friday. As Lee Adler has already noted (and linked in previous reports), the real estate market is ripe for yet another rout.
WY looks like it’s providing advance warning.
11/26/16: If, Then, Else
If, Then, Else. Anyone with a science or programming background knows this term.
That’s where we are with real estate.
IF, the retrace to the 23.6% level is complete, THEN, an immediate sharp move lower is expected, ELSE, there's more upside potential.
Just as with GDX, identifying the down move to the day, and the hour (11/9/16, GDX update), IYR may begin a decline at or before the open on 11/28/16.
If a gap-lower open is not obvious, or if it does not commence immediately at the open, then we are looking very closely at getting out of the (SRS) position.
There’s no problem with being wrong … it’s not getting out of the ‘wrong’ that’s financially fatal.
However, if we do have a gap lower pre-market session … and remember, significant pre-market trading activity in IYR is unusual, then it’s time once again to take full advantage just as was done with shorting GDX.
11/25/16: Real Estate, Correction Finished?
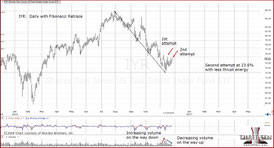
Real estate may or may not have broken its down channel line (noted Wednesday) in today’s session.
Subsequent price action will decide. What we have instead, is a second attempt to rally past the Fibonacci 23.6% level.
Markets typically retrace to a 38.2% or 50% level. In the case of IYR, observation shows that typical price action tends towards the 50% level.
If 23.6%, is as far as IYR can get, it signifies heavy resistance to moving higher.
Lee Adler just posted another one of his missives on Stockman’s site (now subscription only) and effectively presented with supporting data, real estate for this go-round of the economy is finished.
The bond market has cracked and 30yr mortgage rates are rising briskly.
Since our corporate account is now fully allocated, it’s time to review the strategy that got us here. Back in August of 2015, or thereabouts, the following market thesis was constructed:
- Bull market in bonds from early 1980s, to present is over or nearing an end: Rates to rise significantly and persistently.
- Dollar will rise to potentially uncontrollable levels as a result of world-wide short positions in the currency (brought on by artificially low interest rates)
- Dollar rise may/would affect gold and shove it down potentially below $1,000, then $750, and maybe lower still
- Uncontrollable dollar and interest rate moves (upward) could only have one outcome for the general market: Crash
- As a result of the financial engineering, pilfering of corporations since 2009, interest rates moving substantially higher may/would cause large number of bankruptcies and affect the manufacture, sale and distribution of all products (i.e. food, medicines) on unprecedented scale.
- As a side-liner, there never really was a full blown economic recovery and thus, no consumer fuel to power sales and earnings higher … notwithstanding any current Black Friday stupidity.
Since that time in August of ’15, data has been obtained to verify, negate or modify the premise.
At this point in time it appears that all events are on their way to fruition except for two: Market crash and corporate bankruptcies (with follow-on effects).
Positioning for the above scenario went into overdrive starting in September. Performance for the past three months is shown below for illustration purposes only:
September: -11.0%
October: +37.5%
November (not complete): +284.4%
Important to note, that our company account is positioned for a move that has yet to really take hold, and it’s already up over 300% since late August.

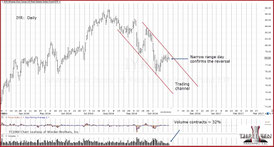
11/23/16: Real Estate Trading Channel Confirmed
11/15/16: Short Real Estate (SRS)
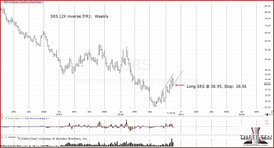
11:23 a.m. EST, Real estate appears to have completed its counter-trend move. Note the trading channel shown on the weekly chart.
Although, the channel is rising modestly at this point in time, it’s been postulated on this site that we may be in a massive crash.
The fact that it’s not made headlines tells us there’s still time to get positioned.
Currently, Three Ten, is short the following sectors:
- Basic Materials (via SMN)
- Biotech (via BIS)
- Real Estate (via SRS)
Basic materials sector is the slowest mover. At today’s session, real estate is the most active.
Update: 4:56 pa.m. EST: SMN exited at the stop 23.09 (stop level previously identified)

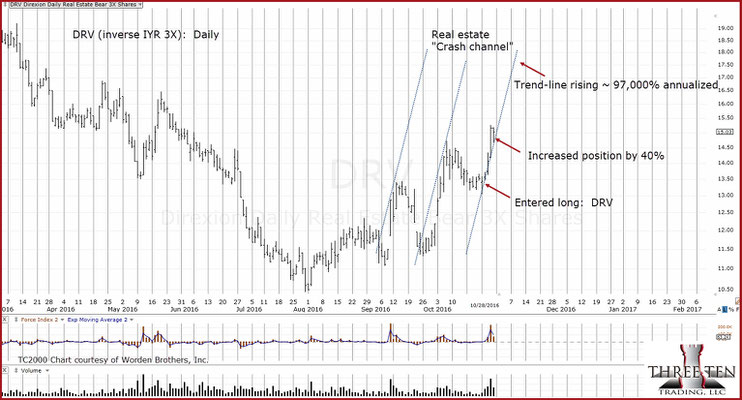
11/7/16: DRV May Contact (and verify) Trend-Line
The bid/ask spread on IYR shows a likely gap-higher open. Correspondingly, the inverse fund DRV will gap-lower.
If the price action contacts and verifies (by pulling away) from the right side channel of DRV, it will probably be the last opportunity available to get into a low-risk position.
The long-term work has already been done in real estate. The potential for a nearly straight-down move first, followed by choppy action (opposite the 2007 – 2009, scenario).
The inverse funds are not suited for choppy action. They lose value even if the market goes sideways. The time for inverse vehicles is when there is a good probability of a sustained move in one direction … down.
Is today the day?
11/3/16: DRV Entry Points
The pre-market in bonds is lower. The pre-market in real estate is weak.
The S&P shows a potential slight gap-higher open that may temporarily influence other markets.
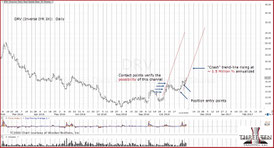
A seen on the chart of DRV which is an inverse fund of the real estate sector, it has established a trading channel. We are at the right side of that channel now and have been there for several days.
If (and it’s a big if), this channel is in effect, then it may be time to move away from the right side line.
The (put) options market in IYR has been worked over the past two weeks. The profits from those transactions have generated enough capital to significantly increase the line in DRV.
Buying and selling options is extremely difficult as the odds are far below 50% (more like 33%) of making a profit.
Is today the day to increase the position in DRV? Buying in at this level is not exactly the best spot. However, both prior entries are well in the green and thus provide some protection from decision errors.
If we are in a real crash and DRV ultimately winds up in the 100s, will it really matter if we entered at 15.00, or 15.50?
Nevertheless, penetration to the downside of the prior session low at: 15.19, would indicate that real estate may have temporarily recovered and used one of its nine-lives.

10/31/16: IYR After The Close
The next session will let us know if Real Estate is going to break its down-trend or reassert.
The hourly chart shows that price action stopped and closed at a confluence of resistance.
This is typically a low-risk area for taking positions. A continuation of the up-move would indicate there is enough demand to negate the ‘crash’ scenario discussed over the weekend.
A move lower at the next session, keeps that same scenario very much in play.
With so many adverse events taking place nationally and internationally, the potential for a decisive and swift break (overnight or otherwise) needs to be incorporated into any trading or investment plan.
10/31/16: Real Estate Pre-Market
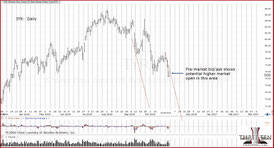
The bid/ask spread in IYR suggests a slight gap-higher open.
We had no put options on this index held over the weekend. There was a probability for a marginal move higher early in the coming week.
The options that expire this week (11/4) are going to decay rapidly. If the upward pre-market bias remains, look for the 75.50 put to go from 0.78 – 0.81, to 0.50 – 0.52, or less.
Once it gets down to 0.30 or so, it's possible to make 500% - 1,000% on a trade.
On the flip side, if instead of a gap-higher bias, the IYR continued on into its decline and was showing a gap-lower open, the open position in DRV would have taken advantage of that event.
The options trades shown in last week's chart are in line with the method described by Dr. Alexander Elder in his book Come Into My Trading Room. It’s counter-intuitive. We are looking for options that are near expiration and not ones that have a lot of time value: The complete opposite of the amateur as he likes to say.
Side note: I met Dr. Elder at a conference in 2005, and was embarrassed that my Russian was sub-par compared to his. He invited all of us (just a handful) to attend dinner with him. At the time, I did not feel worthy enough. Another missed opportunity.
For those who like videos, here is a link from John Howell on the current situation (the pre-amble disclaimer finishes at 0:30).
It’s important to note the complete lack of garbage on his screen. No moving averages, no Bollinger bands, only price-bar and volume. He has a couple of supporting indicators at the bottom but that's not how he makes his decisions.
Also note the number of views. It’s just a little more than 300. What we are doing here is highly specialized, requires thinking and work. Those criteria alone effectively weeds out 99.9% of the average population.
Although he does not mention Wyckoff specifically, he's essentially using that technique to make his assessment.
Real Estate Crash May Be Happening Now


10/29/16: The crash may be happening now:
The S&P is not in full blown descent, yet. It gives the manipulated intention or not, that everything's fine … nothing to see here … while other sectors appear to be confirming their down and potential crash channels.
As Dr. Martin Zweig said years ago, he did not like to use the word “crash” lightly and only did so when it was actually in full swing.
Watch his prediction here. The more important comment however, comes from the sell side (the retail representative), that it’s only a ‘correction’ and there’s nothing to see here.
Especially galling, is that representative’s condescending dismissal of Zweig’s assessment. Hmmm, seems like nothing has changed in that regard.
Condescension is as old as the garden … surely you can be like God. All we have to do is belittle and obfuscate the truth: Voila, we have the delusion of god‑like superiority.
In the not too distant future, when the markets are in full blown collapse, the mainstream money establishment will be clueless on what to do. Accounts are being decimated and their client coddling is in full swing.
Ultimately, there will be some that figure out it’s up to them. They’re the only ones that are responsible for their own accounts. If you are reading this, you’re already one of those few.
From a personal standpoint, I have talked and met with many brokers and managers. All of them were, and are, smart people: That is, textbook smart.
All of them could probably beat me with their ability to regurgitate rules, financial statistics and investment strategies. I can’t hold a candle to a Magna or Summa Cum Laude of the graduating class.
Even the Dean of Engineering at Texas A&M, laughed out loud (head back mouth open) at me when I asked if I had a chance of being accepted and graduating. “We’ve got a lot of really smart kids here at A&M”. The inference was that with my 960 SAT score, I was not one of the smart ones. The average at that time (the late 70s), before the SAT’s were dumbed-down was 1,100 … the average.
However, none of those managers …. none that I have met were are able to read the tape and discern what is likely to happen next. It takes years to reach proficiency and it’s just easier to settle back into mediocrity, gather funds and collect 2% management fees and periodically take a few clients to the golf course.
This market meltdown is so much more than just the charts. It has been widely researched and reported the majority of the corporations in the S&P have been effectively looted.
Once the cost of money goes up (and that’s happening as we speak), it will be harder to continue to borrow money, buy back shares, pay executive bonuses, pay out dividends with borrowed money (like IBM as just one example) and continue the looting process.
When rates go up, how many of these companies are going to go bankrupt and go bankrupt quickly. If the company that makes the polymer for the plastic top on the oatmeal tube goes bankrupt, then how is the oatmeal manufacturing and packaging going to make it to market … all over a plastic top?
Yes, it could and is likely to happen. No plastic top, no oatmeal. Even though there's plenty of grain.
It seems that for all except one of my peers, they don’t have a clue what is really happening. Their thoughts, actions and conversations are still centered on things such as basketball and the World Series (just two examples).
They know that something’s up, but are too inert to actually do anything. After all, no one else seems to be doing anything and of course, there has been no guidance from the government to take action.
My firm’s objective from the outset has been to effectively work this market all-the-way-down (as long as the market remains open).
I personally have spent a small fortune, somewhere around $250,000 to $500,000 in market education. Education that has consisted of gains, then losses, missed opportunities (like not buying physical gold at $241/oz in 2001, when I knew it was going higher), mentoring, education, and countless, countless books.
Dr. Alexander Elder (and Wyckoff) stated long ago, that if you survive the education period, it will have cost as much or more than a four year college degree.
We’ll I am personally there now. Granted, the education never ends. However, I sense the internship is over. It goes without saying that if you are reading this, I propose there is no one else, not your peers, money managers or anyone else you know that has put in the time and paid the dues.
One of my colleagues said a while back:
“You will never be hired by a management or brokerage firm. Your technical capability if far beyond them and you would be too much of a threat.”
That’s a quote (near as I remember it). That was from a Series 7 holder and former broker of a major, well known firm. He may even be reading this now.
So, it’s gone from head-back laughing in my face (you’re an idiot), to you’re so good you’ll never be hired.
Is that not the challenge to all of us no matter the skill level? It’s not much different than the Biblical story of the talents. We all must take what is given and make it more lest that which we have be taken away.
“Therefore take the talent from him, and give it to him who has ten talents.
For to everyone who has, more will be given, and he will have abundance; but from him who does not have, even what he has will be taken away. And cast the unprofitable servant into the outer darkness.” Matt. 25: 28-30
There is no choice. Burying one’s head (minimizing losses on the way down) or focusing on basketball and the World Series is not going to bring more.
Contact us via this link, if you want to improve your tape reading skills. We can’t tell you what to do (that would be classified as ‘advice’). However, we can show you how to discern the truth.
In closing, there are links presented below that are recommended. They’re in line with the ‘plastic top’ assessment above. This time around, it’s so much more than just a ‘market correction’:
https://www.youtube.com/watch?v=YwoYgKaR9Rw
https://www.youtube.com/watch?v=4drULljFAgU
https://www.youtube.com/watch?v=8qs7FEJTmLs
Just as in the days of Noah, the masses took no action, ridiculed the truth and continued on as if nothing was about to happen. Being prepared is a Biblical concept.
Paul V. Mosgovoy
President: Three Ten Trading, LLC
Password Access Sneak Peak
Here's a recent sample of what is available with password access. The low risk opportunity (to short) has passed. That allows the chart above, and comments below, to be released for public view. Password protected text in bold italics.
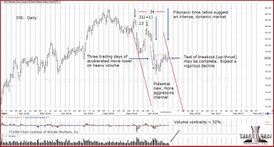
10/25/16: The real estate sector, IYR attempted to move higher during the session after a gap-lower open.
Attempting, struggling to move higher took all day. At the end, we see volume contracted approximately 32% over the prior session.
A contracting volume scenario on an upward move (after a reversal), is classified as a test of the breakdown.
The light volume indicates less conviction to the upside. Therefore, we should expect continued downward action.
Today’s and yesterday’s action may have confirmed that a more aggressive down-move is ahead. There are Fibonacci time characteristics between the noted price action highs as well as the 10/16/16, low.
As of this post (6:41 p.m. EST), the S&P futures market is already down -0.20%. It's a long way to the opening tomorrow and the nascent move lower may prove to be nothing.
Overnight action rarely goes past 0.50% either way unless there is significant demand or supply. The time to re-assess the market will be after the data releases, beginning at 8:30 a.m. EST.
10/25/16: IYR Reversal Tested
The real estate sector, IYR attempted to move higher during the session after a gap-lower open.
Attempting, struggling to move higher took all day. At the end, we see volume contracted approximately 32% over the prior session.
A contracting volume scenario on an upward move (after a reversal), is classified as a test of the breakdown.
The light volume indicates less conviction to the upside. Therefore, we should expect continued downward action.
Today’s and yesterday’s action may have confirmed that a more aggressive down-move is ahead. Additional detail and Fibonacci time analysis is located here.
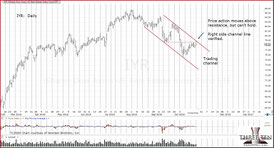
10/24/16: Real Estate Channel
While it looks like the biotech sector might actually attempt a retrace up to underside resistance, real estate appears ready to move lower now.
The gap-higher open in the S&P allowed us to ‘look’ for the sector(s) that were not responding or responding the least.
At this point, that sector is real estate.
The right side channel line has been verified during this session and the overall look of the price action suggests lower levels ahead.
The dollar continues its relentless march higher and in so doing may be putting pressure on the sensitive sectors: Gold and the gold miners, basic materials, real estate
Out of all those sectors, our prior research indicates that real estate has the best potential for a swift and sustained move lower.
Our own short position has been alternating between short biotech and short real estate with the expectation that one of these vulnerable sectors will ‘let loose’ with a massive move lower.

9/17/16: Real Estate Follows Plan
Real estate may have a positive bias leading into the Wednesday (2:00 p.m. EST) Fed announcement.
That bias may take price action up into the test area as shown.
This market has broken lower decisively. Resistance is significant and well established. The (upward) story in real estate is most likely over.
As a reminder, back on May 7th of this year, a long term forecast was presented for this market. It included the likely direction: that IYR would continue to rise into resistance (taking several months), then reverse lower. Indeed, the index has done just that and reversed exactly where indicated. The forecast came within 0.30 pts. (or 0.35%) of the actual reversal level.
It’s what happens next that’s the key item. If the analysis was correct on the move higher and reversal, that same forecast is likely to be correct on the next move.
Details are here. Note: Within the protected area, scroll down to see the 5/7/16, update.

Wading Into Danger: 8/30/16
The real estate data continues to roll in.
Not only is real estate going to get its own sector which is an indication of popularity, we now find out (as if one did not know already) the entire dividend ‘play’ could be the most crowded trade world-wide.
One has to love this article's statement of the S&P ‘breaking convincingly’ to the upside.
The S&P has not done anything convincingly other than claw, scratch and grind, grind, to new highs …. all while large segments of the market have already made their tops long ago. They are now making counter trend highs: AAPL, CELG, IBM, and XOM along with many others.
This site and the data presented herein is about finding the danger point; Seeking out areas of market instability.
Danger in the market sense is not the same as ‘buying at the top’. That’s not danger …
Danger is wading into uncertainty and using the sharp edges of perception, analysis and intuition to make a decision.
Real estate and biotech are two sectors at danger points. They could go either way.
As stated on our companion site, the risk is least right here. The cost of being wrong is small.
It’s at points like this where thoughts can be clear and positions established while the crowd is still too afraid to act … until later when it's obvious … and then they sell or sell short at the bottom. That’s not danger …
As stated many times on this site, if this market really does let loose to the downside, there's no guarantee that inverse funds or options or futures or anything else will still be trading. The market could be shut down.
Wading into danger, establishing positions and working the market during what may be the largest wealth transfer in history, is better (to us) than being a turtle-in-the-shell, spending all one’s time ‘minimizing losses on the way down’.
We all know, or should know the words of Ben Franklin: “Those that trade liberty for security …"
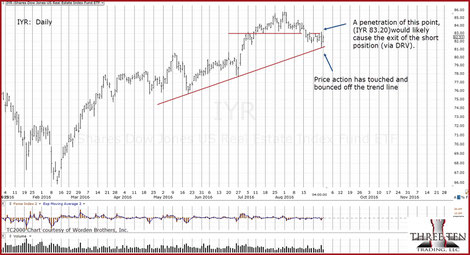
Real estate bounces: 8/29/16
IYR made an attempt to move higher during the session and closed near the high of the previous session.
We can see that it's clearly stuck between the support of the trend line and overhead resistance ... which implies a constricted market likely to break higher or lower sooner rather than later.
If there is enough demand to push though the 83.20 high as noted, the DRV position will likely be closed out.
Additional detail on the technical nuances of this move are in the password area at this link.

6/9/16, IYR Short Exited
Real estate (proxy, IYR) never fully recovered from the 2007 – 2008 melt-down and has not made new all time highs.
It is well known that retail sales are down substantially and at some point, we anticipate that REITs will begin to cut their dividends en masse. Note, the article in the link was written two years ago … the situation is only more precarious now.
Therefore, the objective from a trading standpoint is to be positioned before dividend cuts are announced. At the time of a major cut, the sector will likely have a huge (overnight) gap lower that prevents a low-risk, low-volatility entry.
Taking Wyckoff’s cue that somebody always knows something; all decisions are reflected in the chart, there was a potential opportunity to position short on the real estate sector.
The daily chart of IYR shows an attempt at going short. The sector continued to drift higher and the position was closed out with a minimal loss.
Just like the rest of the market, at some point IYR will take a hit to the downside. The chart itself will define the next opportunity.
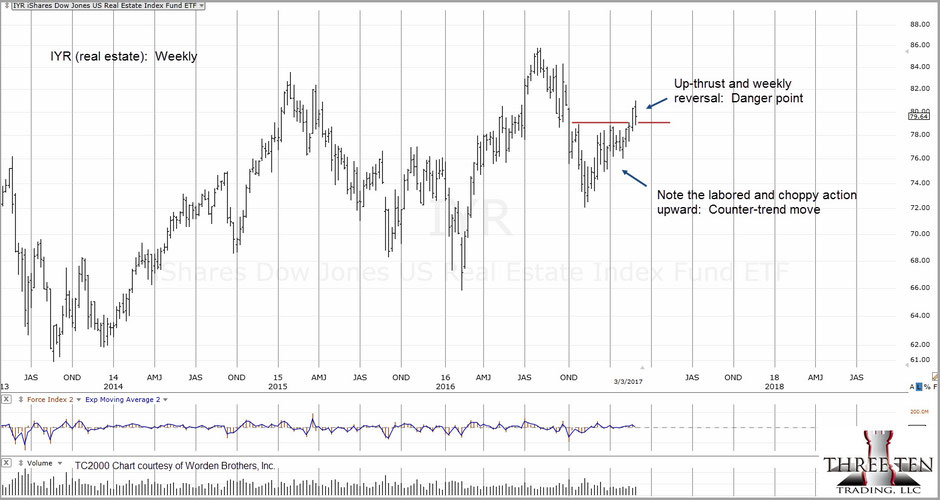
5/7/16, Real Estate, IYR:
The short position was quickly stopped out when it was apparent that an up-thrust was not at hand.
As the current week was Fibonacci week 13 from the December '15 lows, and with price action hesitating at the new highs, there appeared to be a short opportunity.
The two charts of IYR show the next trade potential.
Years ago, it was observed that real estate events tend to occur on weekly time-frames.
Therefore, the next likely short opportunity may fall on Fibonacci week 21, prior to July 4th. Markets tend to have significant reversals just prior, during, or just after a holiday week.
Not only is week 21 a holiday week, it is also an area (if the market gets that far) of maximum resistance in addition to a Wyckoff up-thrust zone.
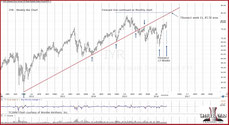
The last significant move lower in 2007 – 2008, had a complex-simple price action structure.
Using alternation, one may forecast that if the point indicated is indeed a significant pivot point (lower) that price action may follow a simple-complex structure.
This (simple) structure is well suited to an inverse ETF, as those funds do not perform well in complex environments.

5/6/16, 10:37 a.m. EST Real Estate, IYR:
Real estate may have topped-out.
After the recent price shock (downward arrow) , a labored move higher has resulted in new highs. However, momentum has slowed considerably as seen by the narrow daily ranges.
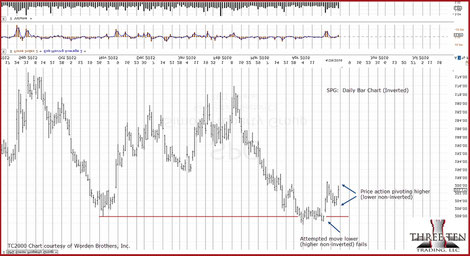
5/2/16, 9:02 a.m. EST: SPG Pivot Point
It has been a while since the last update on Real Estate. Now, it too seems to be entering a potential down-trend reversal.
SPG is the largest cap equity of the IYR, ETF and is therefore used as the proxy.
The chart shows clear signs of an attempt to move higher that has failed.
While still at the danger point, a new high for SPG remains a possibility. However, with overall interest rates inching higher, this rate sensitive sector appears to be at a pivot point.

1/3/16
Back in the day when we used to post on Seeking Alpha, one “follower” commented that looking at inverted charts was annoying and requested a 'cease and desist'.
Instead, what we did was to cease posting on Seeking Alpha.
Mind and attitude flexibility is a critical skill. If one can not look at an inverted chart and continue on with the analysis, the road ahead to market proficiency will be long indeed.
The chart is the long bond inverted (TLT as the proxy). We are effectively looking at a chart of interest rates (bonds down, rates up).
What is shown is a reversal, test, continuation of the reversal and then a pull-back for a secondary test. At this juncture, rates are going up. Therefore, real estate going down may not be far behind.

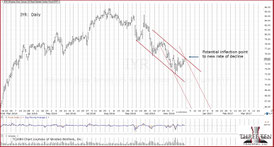
11/22/15
The five-plus year uptrend in real estate has been decisively broken to the downside.
Price action over the past few months has been making a labored attempt to test the underside of the trend-line.
Note that IYR never made new highs after the 2007 - 2008 collapse. The entire move from the 2009 lows, could be viewed as just a bear market bounce.
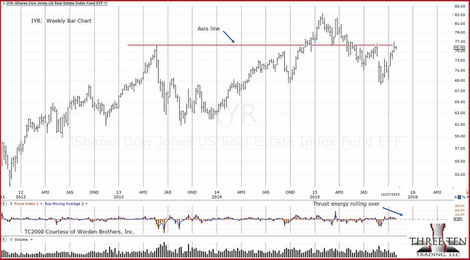
10/28/15
IYR has rallied back up to test the underside of the axis line.
Note that during this rally, thrust energy (lower blue arrow) shows a weakening of the upward momentum.
IYR appears to be at an important juncture. Additional technical details here.
9/22/15
IYR failed to move lower as was expected in the previous analysis.
The short position was stopped out with a profit. Details are at this link.
A wedge appears to be in the early stages. How IYR acts if/when it gets to the upper resistance line may determine if there is a trading opportunity.

8/25/15
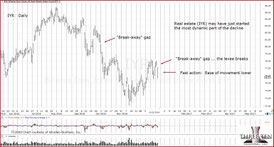
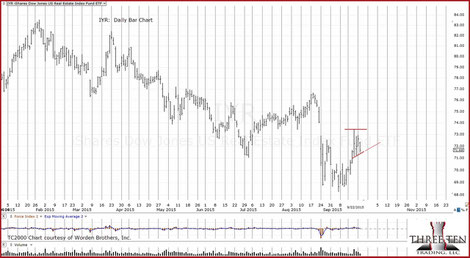
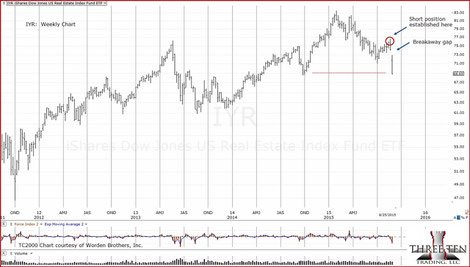
IYR shows a break-away gap to the downside.
The long bond (TLT) appears to be in a reversal as well. If the bond reversal takes hold and rates rise, IYR may see dramatic downside action.
Details on the short position are here.

8/22/15
The daily chart of IYR shows a text-book perfect up-thrust.
This up-thrust area was located between the 38% and 50% retrace levels (not shown) from the prior down leg which started at the 83.54 high, and terminated at the 71.07 low.
A pull back that is below 50% is considered weak.
Significantly lower levels are the next potential for IYR.
8/19/18, 9:50 a.m EST
Updated real estate positions are here.
8/18/15
Updated real estate chart is here.
8/15/15
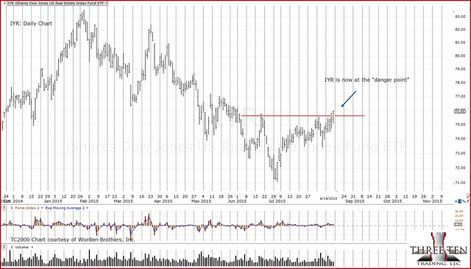
The IYR is now in an upside breakout and has reached the danger point (maximum tension between bulls and bears).
Housing data will be released early next week.
Details on how we are positioning in this sector are here.
8/11/15, 1:57 p.m. EST
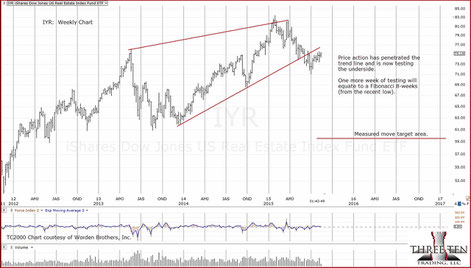
IYR continues testing the trend line break.
We are coming up on a Fibonacci eight-weeks of price action since the most recent low.
A specific target area at this link has been identified that may be the pivot point for the sector.
