
5/18/20
IYR Showing Gap Higher
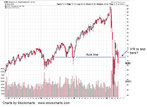
It's about one hour before the open; Pre-market trading in IYR is near the axis line shown.
Risk/Reward looks good for a short position (not a recommendation) at this location: ~ 72.00.
Charts by StockCharts
5/17/20
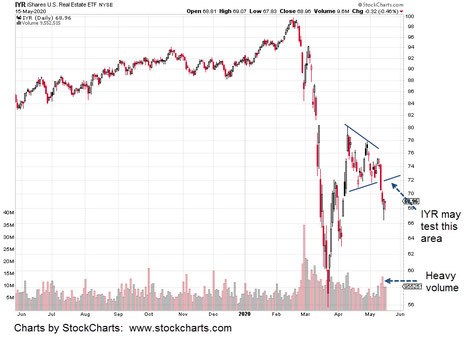
IYR broke to the downside. Typical market action is to test high volume, wide bar moves. Note the wide bar and high volume on the break.
There could be such a move (test) in the coming week.
Monitoring price action in the area noted may provide a potential low-risk entry for a short position (not a recommendation) via SRS or DRV.
Charts by StockCharts
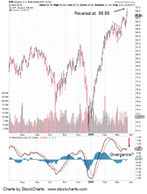
11/27/19
Real Estate (IYR) Reversal Test, Target
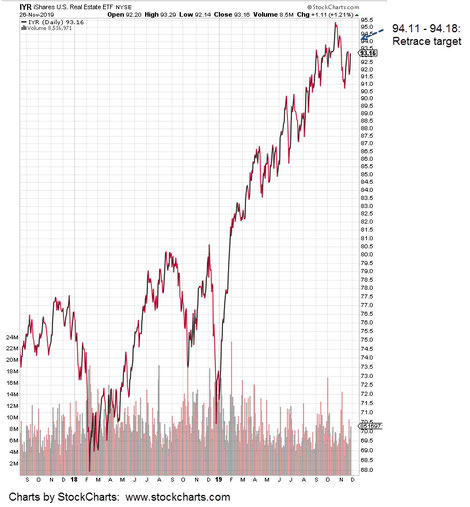
October 19th, price action (analysis) projected a top and potential reversal at the 96-level.
The IYR did just that: Hitting 96.00 exactly and reversing from there.
Now, we have what looks like a test of that reversal.
IYR is forming a typical a-b-c correction-retrace pattern (see Elliott Wave Principle, if needed for more on a-b-c) and the projection is to 94.11 – 94.18.
Is this The Big One? The Crash? The next crash has been predicted, ad nauseam since the bottom in 2009. So, it may or may not be 'the big one'.
What does appear to be developing is IYR approaching the danger point, where a downside (short) entry is at lowest risk.
Charts by StockCharts

10/19/19
Real Estate: IYR Projects to 96. Then, what?
IYR has a short way to go for the projected target. What happens after that? Inverse funds for the sector to work the downside (short term) are SRS and DRV.
Inverse fund SRS is a 2X inverse of the sector and has about double the liquidity of DRV (which is 3X inverse).
A potential strategy my firm might use, is to fade the market. As IYR approaches the 96 area, begin to sell into the advance with small position(s) in SRS.
If not stopped out, then continue to build as market action dictates.
This is not a recommendation: Subsequent IYR price action could negate this approach.
Charts by StockCharts

7/11/19
Pre-market at 8:52 a.m EST
It’s the pre-market session and the bid/ask on IYR indicates a higher open.
If so, we’re in an uptrend to new highs that is also showing a potential, yet unconfirmed bearish divergence.
Pre-market activity in bonds is down, with rates rising.
We’re looking for a break of the trend-line as a clue the move is over or has stalled
Entry opportunities in one of the inverse funds, SRS or DRV will be assessed at that time.
Charts by StockCharts

7/9/19
Mid Session: 11:30 a.m. EST
Even as bonds enter a correction or reverse outright, commercial real estate (IYR) looks like it wants to make a new high.
The dashed trend-line may be a blow-off top … which projects to this week or early next.
Potential news catalysts for a new high are FOMC minutes release tomorrow, the 10th and Weekly Jobless claims on Thursday, the 11th.
Financial Calendar link is here.
From a Wyckoff analysis standpoint, what’s in the release is not important. The news event itself and the following financial press machinations, provide enough excuse for professionals to drive prices where they want.
Charts by StockCharts

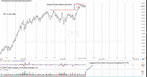
6/30/19: Real Estate (IYR)
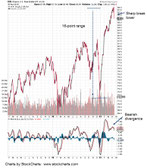
Looking at the long term chart of real estate (IYR) we see each major draw-down or reversal covered about 10-points.
The index may be reversing again … and as with each reversal, it may be the last time.
If we’re in another downturn, from an empirical and statistical standpoint, we can expect to move approximately 10-points lower before the next attempt higher.
Leveraged, relatively liquid inverse funds for this sector are SRS (2X inverse) and DRV (3X inverse).
Charts by StockCharts
4/17/19
Real Estate Breaks
IYR may attempt a rebound off the lows in the early session or it may just keep on going.
Note the significant bearish MACD divergence on the daily chart
The weekly (MACD) still shows some upward momentum which may point probabilities to a short-lived upside test.
Either way, it looks like there is downside opportunity.
Charts by StockCharts
3/23/19
Real Estate Reverses
In the 3/15/19 update (see here), the IYR was projected to reach the 87 area as a measured move. IYR reversed just shy of that mark at 86.99.
It’s interesting that we have a reversal in this index while at the same time, the long bond reached a new (post 11/2/18) reversal high with rates going down correspondingly.
Which one is the weaker?
The fact that IYR reversed perfectly at the measured target is probably a technical point only. Plenty of other traders saw the set-up and acted accordingly.
Note how the MACD divergence is ticking slightly higher. Not as weak as it looked earlier.
So, the real story (and opportunity) may be in bonds; More on that in the next update.
Charts by StockCharts
3/16/19
Real Estate ... Beuller Edition
With real estate absolutely stretched, the professionals look like they're getting out.
At the end of Friday’s session, the IYR had the largest two hour (down) volume as far back as we have data. All the way to August 17th of 2018.
On top of that, it was the largest four-hour volume as far back as January 23rd of that year.
If you look at the daily chart, the volume does not appear all that significant. It’s as if the pros are trying to hide their moves within the data.
After all, who looks at two-hour and four-hour charts anyway?

3/15/19:
Real Estate Topping Out
(pre-market)
The real estate sector (IYR as proxy) may be in the last stages of its move off the December 26th lows.
A wedge pattern typically occurs during the end of a move … either up or down.
The measured move off the upside breakout is to the 87-area. IYR is already posting a bearish daily divergence as seen in the MACD below the bar chart.
If and when it reverses, initial support is 83 – 85 but after that, it’s a long way down to the next levels.
Charts by StockCharts