

6/3/19
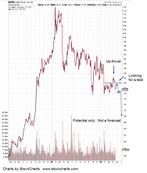
ABBV Breaks Lower
Once again, ABBV is sporting an aggressive downtrend.
This time, price action breached the 52-week lows.
If there is to be a downside ‘surprise’, right about now is a good time.
An alternate view (as before) is that support has been penetrated and ABBV is again in spring position.
Charts by StockCharts

5/31/19
ABBV Put Option Results
One of the recent trades in ABBV is attached. Note how the sideways action was avoided.
With near-expiration options, sideways action bleeds off premium. The objective of the method used was to eliminate as much of that bleed as possible.

5/25/19
ABBV Reversal
The ‘spring to up-thrust’ set-up is clear: Whether or not this is the beginning of a 20-plus point decline is unknown.
If the set-up is in-effect, at the minimum we can expect a decline to the bottom of the trading range … somewhere in the vicinity of 75 – 76.
After that, a trading range measured move projects to the 71 area.
Note the Fibonacci relationship is still valid. There's a difference between “print” high and “close” high.
The High, Day 1, on the chart is the print high. The actual close high took place three days later. The Low, Day 1 is the print low. The closing low was the following trading session.
So, we’re still within acceptable limits of a reversal based on Fibonacci time relationships.
Charts by StockCharts

5/22/19
ABBV Setting Up For Lower Open
ABBV posted a new daily high right on schedule during the last (Tuesday's) session.
A push below the prior daily low, 80.32 will help confirm an up-thrust and potential significant reversal.
Pre-market activity points to a lower open: Currently trading at 80.52, down -0.36 or -0.45%.
The attached chart has the Fibonacci relationships identified between successive highs and the low posted on May 10th.
Price action has been in a tight range for the past four months. Tight action typically precedes a sustained breakout
Charts by StockCharts

5/19/19
ABBV Tuesday Turnaround?
In the 5/13/19 update, the alternate scenario of a spring set-up was identified. That appears to be the case with ABBV. However, there is a caveat.
Even though price action is moving higher (from the 5/10 lows), the character has changed. Each day shows ease of movement lower with attempts to move and close higher.
Long term, ABBV is trending down, with six trend line contact points as shown.
If there is an up-thrust in the cards, a potential time-frame may be this coming Tuesday, 5/21; a simultaneous Fibonacci Day 34, from the 4/3/19, high and Fibonacci Day 8, from the 5/10/19, low.
Charts by StockCharts

5/14/19
For ABBV to maintain its downward trajectory, it must have a lower open followed by continued downside action.
If there's a higher open, something else is at work and any current (short) positions may be exited.
At this point, 8:15 a.m. EST, the bid/ask spreads are pointing to a higher open.
However, in pre-market trade not all participants are present. I’ve seen the actual open be significantly farther away (up or down) than pre-trade activity.
We’ll see what happens.
Charts by StockCharts

5/13/19
(12:31 p.m. EST)
ABBV price action is following the plan; posting and inside day, helping to confirm the down-trend line.
At this point a reversal (up-ward) is still possible. After all, having penetrated support at the 76.00 - area, ABBV is in spring position. Both possibilities are operating simultaneously in the market.
However, with each passing day as ABBV follows the script laid out weeks ago, probabilities continue to favor a significant breakout to the downside.
Charts by StockCharts

5/12/19
We’ll find out on Monday (5/13), if the trend for ABBV downward is going to continue or if we have a reversal. Once a trend line gets to -90% annualized, there’s not much room for error on the analysis.
With ABBV trending lower for over a year, we’ve already established the up-thrust and test scenario.
In addition, the wild swings from January ’18 to January ’19 are over and price action has become tight.
Tight action is a coil; providing thrust for the next major move
As with TSM, the expectation (for a bearish set-up) is that we get some kind of inside day or a continuation lower.
Charts by StockCharts

5/4/19
Then and now:
The two charts of ABBV side by side (click here), show the original expectation and the current action as of Friday, 5/3/19.
What the chart is telling us is that so far, ABBV is following the typical pattern for an up-thrust, test, reversal and collapse.
Anything can happen and the trade set-up could dissipate into thin air in the coming sessions
However, at this point all eyes should be on this one. The contradiction is that one must maintain an air of emotional distance. The charts say that ABBV has the potential to drop anywhere from 15 – 20 points or more.
That might not sound like much but for example, let’s say we positioned with a short term put option with a strike at 72.
Putting in a modest thousand dollars, albeit fiat currency J, at an estimated price of 0.25 (I’m making that up … I have not positioned at 72 with any contact).
That gives you 40 contracts. Then ABBV drops to 64, during the expiration week of the option. That’s 8-points. Here’s the math. 8x40 (at $4,000/point) = $32,000.
It’s still fiat (digital, electronic dollars) but at least it can be extracted from the trading account and turned into actual wealth.
Of course, if it does not work out, the option goes to zero. That's the nature of the game
5/4/19 & 5/10/19, mid session
The two charts of ABBV, show expected and actual price action. Click on one of the charts and then use the right arrow to toggle between the two.


5/3/19
ABBV Wedge Pattern
It's mid-session on Friday. ABBV may be setting up for a breakout to the downside.
The problem is (depending on how you look at it) a breakout lower or higher in the Biotech sector can happen all at once. One day it's at one level and the next, you're up or down 50% or more.
Anything can happen and ABBV could move higher. However, we’ve already had an up-thrust; Now, price action has tested and reversed.
Charts by StockCharts
4/19/19
ABBV: Now Comes The Test
ABBV broke below support at 80 and moved easily lower to 76.81, before slowing and starting a possible retrace.
At the same time, the entire biotech sector (IBB) broke below its support level around 106, and moved lower.
Next week, we’ll be watching for some kind of underside test in the 79 – 80 area for ABBV.
The annotated chart shows a potential example of price action. No one knows exactly what will happen; ABBV could open gap-lower or higher at the next session.
However, so far price action is well behaved; indicating it's on track for an underside test.
The fact that ABBV has failed its breakout with an up-thrust, tells us we’re correct (thus far) to focus on this particular vehicle in the biotech sector.
Looking at the put options table for next week (expiring 4/26), shows high volume activity in the 77.00 put at 2,194 contracts. If that volume results in a correspondingly high level of open interest, then we’ll have available sellers (low bid/ask) if ABBV begins a retrace.
Currently priced at 1.36 -1.46, it’s way too expensive. If there is a retrace and if that retrace can last a few days before reversal, the bid/ask on the 77.00 may drop significantly.
Ideally, something below 0.50 and preferably below 0.25 is the target price. If we can’t get a bid/ask at that level, then going lower (i.e. to a 75.00 strike) in the put table may be required.
Of course, all of this depends on the price action of ABBV itself.
Charts by StockCharts
4/15/19: ABBV Update
With about 3,300 shares traded in ABBV during the pre-market, it looks as if we’ll open just a bit higher.
A natural market behavior would be to attempt a move off the 80-level support.
Let's see how that goes. If price action pushes significantly below that level, then our up-thrust has another data point of confirmation.

4/13/19
ABBV Danger Point
What happens next week may tip the scales away from a major drop in ABBV or set the stage.
There’s confirmation of the right side channel line with last week's pull-back.
We’re currently in up-thrust position.
If the 80-area does not hold, the downside is at hand
Charts by StockCharts

4/10/19
AbbVie Zombie
For the past two and a half months, ABBV has been congesting in a tight range only to blip above established resistance.
As the S&P marches on higher, we’re on the lookout for equities that are not participating; or even better, have their own agenda.
ABBV looks like it might be in a class of its own.
BigCharts lists the dividend yield as 5.18%. One wonders how long that can last with a Book Value at minus - 5.65, and Debt to Equity also minus at a whopping - 414.40%. (www.worden.com)
I’m not sure I’ve ever seen a minus debt to equity … that’s new. You’re welcome to help me out on that.
Then there’s the headquarters location. Chicago, Illinois. What a wonderful place to work. If I don’t get shot on my way to work, I can always turn on the news to find out which one of my co-workers did.
How can an entity like this attract quality employees?
Price action is languishing and may be at a pivot point. We’re watching to see if the upside breakout holds or fails.
Failure, obviously results in opportunity for the downside
Charts by StockCharts