

3/14/20
BTU: ‘Weis Reversal’
When I worked with David Weis some years ago, he told me the chart pattern used as his website logo (link here) was his favorite reversal pattern.
After a 94.75% decline from top to bottom, has BTU finally hit the lows?
The buy signal (not financial advice) for the reversal came when BTU penetrated the prior session high at 2.86.

12/15/19
BTU: New Lows Before Year End?
Price action is at the danger point. BTU could break-out from here or head lower for one last downdraft before year-end.
Posting a new low 52-week (and all time) low before December 31st, would put BTU in spring position.
If so, BTU may be an excellent candidate for a ‘January effect’ trade.

11/26/19
BTU Bottom
The chart of BTU on a closing basis has included the Force Index readings for the last few waves down … and up.
Lessening pressure on the down-legs into the reversal is clear.
Now, we have an up-leg with a potential test (today).

11/20/19
BTU: Change of Character
Price action in BTU has changed character. Since the beginning of the down-thrust capitulation there have not been five successive rising 30-minute periods (finishing at the top of their range); that is, until today.
It’s mid-session and BTU has just posted a new daily high (pushing above 9.14, from the last session).
Even the BTU bears are astonished the collapse. To them, the valuation now becomes ‘strange’. For more on BTU fundamentals, go to seekingalpha.com and enter BTU into the search engine. You’ll get the usual suspects saying that ‘coal is dead’.
Price action at this juncture may be just a trade back up to the 15.00 – 16.00 area, or the beginning of a long-term strategic reversal.
Meanwhile, our proxy for coal, NewCastle shows that price has flattened out and may be reversing higher.

10/13/19
Change of Character?
Peabody Energy (BTU) reverses, Rix’s Creek mine extension approved.
The two are not related. Then again, maybe they are.
Here is a list of the coal miners in Australia. Rix's Creek is a small operation compared to other miners on the chart.
The important nuance is the approval may be a small, significant change in character for coal. We’ll see.
Taking a look at BTU, there is significant up-volume going into the close along with a nascent trend.

10/10/19
Early session: 11:09 a.m. EST
Early morning action in BTU suggests a strong reversal higher. Both MACD histogram and MACD lines have crossed to the upside (see 10/3/19 update).
The hourly chart shows ease-of-movement higher.

10/3/19
BTU: Out of the fire?
It’s been rough going for BTU. That may be ending.
The measured target out of the wedge has been met. One more push lower to 13.89, looks to have reversed.
From top-to-bottom, It’s a 71% decline. The speculative excesses have likely been washed out.
BTU has also encountered negative news events. The last one, announced inability to restructure debt on favorable terms; driving the stock price even lower.
Price action has set up a bullish divergence in both MACD and MACD lines; a rare occurrence.
On the fundamental side, Events of record breaking cold as a result of lower solar activity (solar minimum) are picking up. This winter in the northern hemisphere is likely to be brutal.
Looking world-wide, Australia’s green energy grid is a disaster … and that’s being nice about it. Power outages as a result of intermittent ‘green’ power and the
Charts by StockCharts
genius of closing down a major coal plant are a given on a go-forward basis.
In case one does not think the U.S. is devoid of such retarded efforts, you can find a host of them at www.beyondcarbon.org
Meanwhile, China and India go on unabated by the climate hysteria (continuing to build and operate coal plants) that has infected the developed west.
If shut down and idled coal plants are to be re-opened, it will take time. Sky-high natural gas prices along with minimal solar output may be the right catalyst. Solar may be down as a result of volcanic aerosols in the atmosphere.
Summarizing:
- BTU may have seen its lows
- Negative news could all be out
- Power grid in Australia is ripe for a complete failure along with potential overhaul of green “thought”. This may be where the world-wide turn-around begins
- China and India continue on, snubbing rest of world. Increasing coal demand
- Some areas of the U.S. may see much higher utility prices as a result of reduced coal (plant shut downs) and reduced solar (less sun) output.
One more thing: The diesel back-up generator business is booming in Australia. So, when the grid goes down, the diesels go up ... spewing out all that global warming carbon.

9/20/19
Capitulation?
Even as early snow accumulates in the upper states, BTU receives a slew of downgrades.
The spring test has failed and in the process, confirmed the wedge shown.
Measured move is to the 14.30 area. If BTU closes near the lows of the day, probabilities are high for a lower open on Monday ... possibly getting to target area.
Last Update: 9/19/19, 8:04 a.m. EST


9/11/19
BTU Heats Up, Pushes Higher
We're just forty-minutes into the session and BTU has penetrated resistance, holds thus far and is trading in a new range.
Some Wyckoff springs just never come back … they launch and that’s it.
There's always the possibility we’ll get some type of (down thrust) gut-check. However, as time passes and price action progress ever higher, probabilities of such an event fade quickly.
Update: 12:27 p.m EST: BTU has up-thrust the 19.00 area and is now coming back to support in the 18.00 area. Depending on price action and volume, this may be our 'test'.
9/9/19
BTU Launches Over 6.25% in Spring Action
Reversal identified to-the-day: Another example of Wyckoff precision.
What happens next is of course, up to the market itself. Typical market behavior is to come back for some type of test.
However, action thrust below the lows with heavy volume last Thursday, stalled on Friday and now today, recovered quickly. Probabilities are low BTU will allow market participants to get on board at low risk.


9/7/19
BTU at Danger Point
With such a sharp, forceful high volume move lower on Thursday, the expectation for BTU was continued downside action. It didn’t happen.
What did happen, is BTU stopped dead in its tracks. There was no new low.
In the Weis video on trend reversals, he explains that when price action penetrates support (downside) or resistance (upside) and stops dead, our ‘ears should perk up and hair stand on end’, just like a pointer.
BTU is just below established support and in spring position.

9/5/19
BTU was closed out at 18.27, just before the swift move lower.
The blue ovals show the cumulative entries. The orange ovals are selling action.
As a result of ease-of-movement downward in the early session, the entire position was closed out.
BTU came out with negative news on its earnings forecast. We're stepping aside to look for a new (entry) opportunity. Taking into account commission charges, the position was break-even.

9/3/19
This may be it for downside action as BTU bears continue to show weakness.
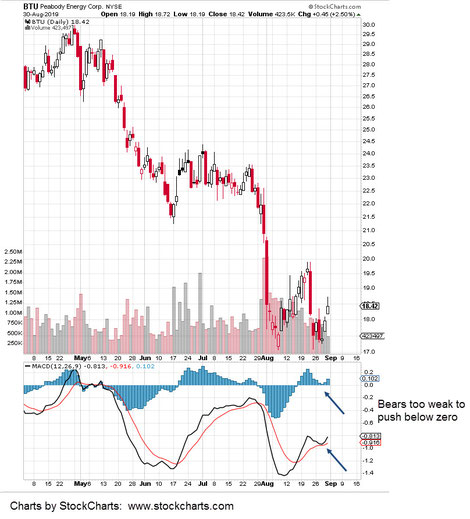
8/30/19
Mass Hysteria Not Enough
Even while “The earth is dying”, the BTU bears are losing their grip on the evil energy provider.
What a kick in the teeth it would be, if we eventually find out the alarmist climate-elites used this opportunity to amass huge positions in the pure-play coal miner.
Alas, that may only be in the far distant future … if we ever get there. Remember, the earth is dying, right? J
As always, anything can happen and we could get a new round of selling for BTU. However, it looks like the window of opportunity at the danger point is closing.
Charts by StockCharts

8/29/19 (before open)
Manipulate The Masses, Manipulate The Markets.
For obvious reasons, we're not going to mention the 'sailor' by name. Look at the chart and decide for yourself the potential purpose for this latest hysteria.
p.s. The link to Elliott Management was originally obtained via MarketWatch (BTU). That link has since been removed from the site. Interesting ...
Update, 11:28 a.m. EST.
Elliott Management link (August 11th, news) can be found on the 'investing' page for MarketWatch, BTU

8/28/19 (11:04 a.m. EST)
BTU bears may be exhausted; Price action in spring position. We’re at the danger point where risk is least.
Charts by StockCharts

8/27/19
BTU Lower and Weaker
The bears may have just exhausted themselves. BTU closed lower today (Tuesday) but did not ‘print’ lower. Down-thrust energy was the weakest since the wedge breakdown of late July.
Special note: Volume change in character. Trading (positioning) activity has increased significantly.

8/25/19
BTU Descent to Fourteen-Percent
Capitulation typically has an accelerated down move during the last phase; as seen here with IBB.
BTU may be at the same juncture. If we include all regular dividends, along with the special dividend on March 11th, we’re currently at 13.63% per share.
Climate hysteria may be reaching another fever pitch … just in time for the early freeze.

8/23/19
The Unquestioned Belief
To paraphrase Robert Prechter Jr., on the topic of long term reversals; he states that catching such a move requires there be a consensus opposite belief.
That belief needs to be widely accepted, fully ingrained and unquestioned.
Seeking Alpha has an article that may be (currently) the best at stating the unquestioned belief. I am not going to link to it on this site. If you like, you can find it yourself. Search for BTU and the result will be obvious.
Price action of BTU is painting a picture of successively weaker down-thrusts. This week’s action may be the last for the lows. We’ll see.
Could BTU go down further? Indeed, it could.
However, one needs to consider at these levels, we’ve got a profitable entity with a P/E in the low single digits that’s paying a dividend (without borrowing money like others) at just above 3.0%.
The lid is being kept on the grand solar minimum. Once it’s undeniable (no pun intended), there may be a scramble for low-tech fuel that you can store in huge heaps outside and hold in your hand.
Of course, there’ll probably be added expense for an armed asset (coal) security team. The precedent for that could be set right now in a different, but related venue: See this report.
Update posted at 2:50 p.m. EST

8/14/19
BTU Bears Getting Weaker
Over the past year, each major thrust lower in BTU has less energy.
The volume has also changed character during and after the last down thrust. There’s a noticeable increase in the amount of daily volume.
This linked video is a typical propaganda piece not unlike that of almost every major corporation.
The difference is, in the comments. The’re only two, but similar attitude (although not as blunt) is also found in this recent SeekingAlpha article.
It’s very similar to what Peter Lynch described in his book One Up on Wall St. as a necessary component in researching potential ‘ten-baggers’.
He summarized that if a description of the industry made you ‘wretch, and turn away’, then he’s interested. These vehicles are the ones that can accumulate significant value under the radar before anyone notices.
Is there any industry at this juncture that’s more derided, vilified and under attack than coal?

8/12/19
Coal Fits Model: Grand Solar Minimum
If we get record breaking cold this winter, it’ll be interesting to see if anyone really cares how their homes are heated.
Peabody Energy (BTU) is out of bankruptcy and has been eviscerated over the past year; dropping over 65%, from its high last June, to its low on August 7th.
At the same time, we’ve got what appears to be a reversal and nascent trend. Similar to natural gas, we’re at the danger point where the risk is least.