
Basic Materials
12/28/16: FCX, Alternate View
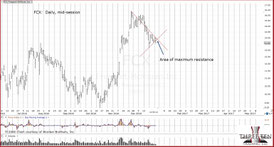
FCX may never make it to an up-thrust condition on or before Friday. The updated chart shows an alternate view.
There may be an underside test of the trend-line break, with simultaneous contact of the down-trend line shown … somewhere in the 13.75, area.
In that event, the plan is … FCX 1/20/17, 14.00, 13.50, or 13.00 Put (at trader’s discretion)

12/28/16: FCX ... Can it Hold?
The FCX put was not performing as expected, so it’s closed.
FCX price action, real‑time remains weak; very weak. However, if FCX can hold it together and get up to a 38% retrace at 14.50, the result is an up-thrust.
If it were to happen, the most likely time would be on Thursday or Friday of this week.
Friday has the Chicago PMI release at 9:45 a.m., EST and may provide some sort of ‘excuse’ to get FCX above the 14.30 area.
With price action exhibiting continued weakness, the shorts are potentially moving in … setting their stops at 14.30 – 14.50, shown on the chart.
A quick move higher into this area takes them out and will provide an excellent opportunity at the same time.
Our plan (subject to change) would be to purchase Jan 20th, FCX 14.00 Puts. There is decent volume and open interest (currently at 18,256 contracts).
If FCX halts its current down move and begins to encroach higher, then we have preliminary confirmation that an up-thrust may be in the cards.
Separately: UEC looks as if it’s about to launch.

12/26/16: FCX Buy-To-Open
With 23-seconds left in the regular session on Friday, the decision was made to buy-to-open FCX, 13.50 puts, that expire on 12/30.
Our transaction was the last of the day and can still be seen in the FCX options table (on your trading platform) executed at contract price of 0.17.
There were 879 contract transactions for the day with an open interest of 1,025 contracts. That’s a decent amount of volume and interest to have spreads be relatively narrow … not the best at 0.02 pts (0.15 bid – 0.17 ask), but acceptable.
Real time observation of the tape during the last 30-minutes of trade, showed price action pulling away from the lows in what was perceived as labored effort.
Reading the tape in real time is an intuitive process. One never knows if the intuition is correct until subsequent price action shows it to be ... or not.
If this trade (12/30) does not work out, the loss at 0.17pts/contract is small. The anticipation is for a lower open on Tuesday, 12/27, with continuation lower so we can close out with profit.
If that move does not transpire, the 2/17 put is already in the money. Providing that some form of down trend is still in place, it's possible the 12/30 put loss may be covered by the 2/17 position.
Each and every trade must stand on its own. That's true with both positions.
However, the position(s) objective is to “pay for” the 2/17 put with the 12/30, and allow the 2/17, to come to fruition.
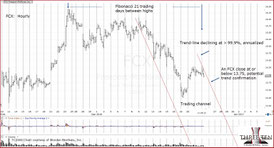
12/22/16: FCX Completes The Test
FCX in a downward channel with trend declining at >99%, annualized. That’s good enough for the short position.
Decisive penetration of the right side trend-line would be an obvious exit signal.
Real estate, IYR is continuing with follow-through downside as well.
As a reminder, important market turns occur just prior, during, or just after a holiday week.
Looks like the S&P topped-out last Tuesday, 12/13, just before this Christmas week, the day we identified the wedge reversal … reference S&P update for 12/13.
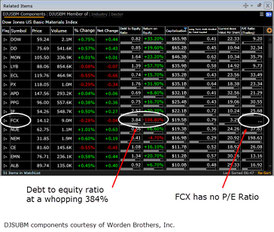
12/21/16: FCX Fundamentals
FCX is being monitored closely and the short position is still active.
If we look at FCX from a fundamental perspective, it tells us why the price action is weak.
Wyckoff stated in “Studies”, all the decisions of all the accountants, money managers, individuals, research departments the world over, are contained in the chart.
Here we see an example where FCX was identified based on the chart. Then, follow-up action verifies that fundamentals are especially weak.
FCX is in serious trouble. Next of kin appears to be Newmont Mining (NEM).
Note: Cosimo Classics (publisher) has chosen to quote us and include a link to our companion website The Danger Point in their book description. Recognition for hard work is rare and thus appreciated. Thanks go out to Cosimo.
Charts by StockCharts
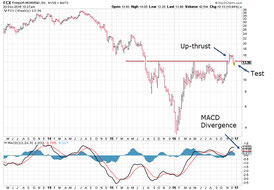
12/20/16: FCX Up-thrust Test
WY showed some unexpected buoyancy at the open and the trade was exited with a profit. Options (buying them) must be timed with surgical precision. If price action decides to congest, the option value decays rapidly.
No problem, on to the next one.
The chart of FCX shows a clear up‑thrust. Price action has dipped below resistance and is now coming up for a test.
Puts were purchased as FCX rose into its test. The options were declining (rapidly) in value as they were being purchased. The expectation is for a continuation of the down-trend after the test is complete.
Trading successfully in the markets requires that one be in a continual state of discomfort. The limbic system of the brain forces one to go with the crowd and applies a good amount of psychological pain with any attempt to resist that force.
Buying options as they are declining in value is certainly painful. Knowing where (and when) to expect the decline to reverse is critical.
With FCX, we’re in position. Both the Feb 17th 13.00 and 12.00 strikes were purchased. It’s fairly straightforward. If price action continues to rise into the next session, we’ll exit.

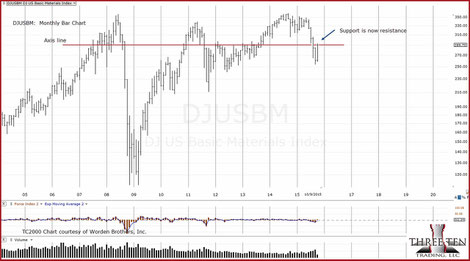
12/20/16: FCX, Monthly
The longer term view shows that FCX has established a wide trading range.
12/17/16: Close Up: WY
The chart shows a close-up of Weyerhaeuser. As Wyckoff and Livermore stated, there are times when the consequences of a news event are not immediately digested. In Livermore's case, it was the San Francisco earthquake in 1906 and his short of Union Pacific.
That may or may not be the case with WY. As Adler states (not in so many words), real estate is finished.
Rates are rising in an already weak, fomented dead-cat-bounce market and now, the last bit of buoyancy (low rates) has been removed. Anecdotal evidence supports this assessment as I have a colleague that’s been in the business about 15 years; his monthly closings are down to “none”.
If WY begins to show demand on Monday, the 19th, then obviously, now may not be the right time for whatever reason.
In that event, our short trade will likely be closed.
However, if WY continues its decline … it may be a long way down before we see any kind of demand … even then, it just might be the shorts covering their bets.
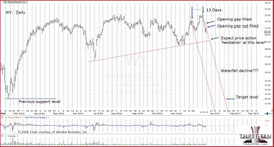
12/16/16: Weyerhaeuser ... Looks Down The Mine Shaft
The market may be stunned, attempting to figure out if demand for Weyerhaeuser’s products has just evaporated.
In previous posts, links were provided to Lee Adler’s reports on housing and real estate. He forecast that November’s numbers would reveal the dire state of the market.
So it is. Starts are down over 18% from the prior month. Demand for building products will likely take a similar hit.
In the case of Weyerhaeuser, we won’t know for sure until early February, when earnings are released.
The market may not wait around until then. Current position (subject to change at any time): Short WY via Jan 13 (2017), put options.
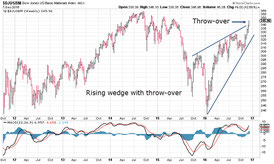
Chart by StockCharts
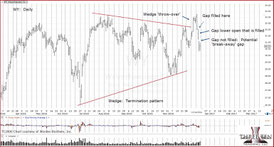
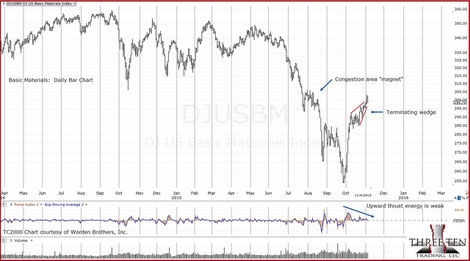
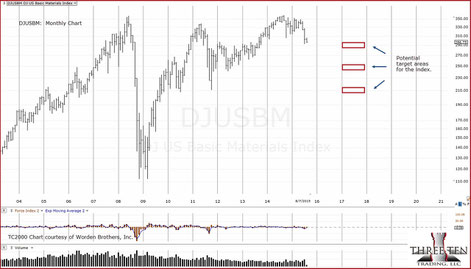
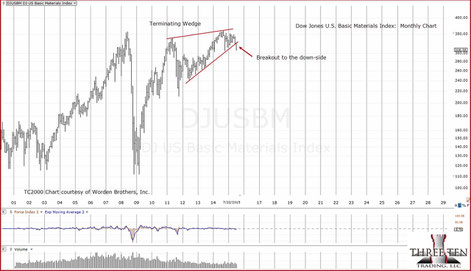
12/8/16: Back to Basics
Not to be outdone by the S&P, Basic Materials is at an extreme as well.
Both indexes are penetrating their upper wedge boundaries.
Charts by StockCharts
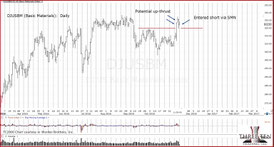
11/29/16: Focus
Basic materials is at the ‘danger point’.
We re-established a short position in the sector via SMN, yesterday and may increase the line today … depending on price action.
Following the admonitions of Livermore, Wyckoff and Loeb, the market has literally forced us out of non-productive positions and into conditions where the market is ready to move.
Laser beam focus has resulted in a significant short stance in biotech and now, potentially in basic materials.
Position focus was Loeb’s market analysis breakthrough. The old E. F. Hutton commercials were referring to him. “When E. F. Hutton (Loeb) talks, people listen.”
11/21/16: Basic Materials Danger Point
With the S&P at all time highs, Basic Materials is at its own high of sorts.
Price action has penetrated (slightly), the prior resistance area. Whenever penetration like this happens, an up-thrust condition is created.
There may or may not be a reversal at this session or subsequent. However, by definition, we are at the danger point where the risk (of going short) is at its lowest.
As discussed previously, the inverse fund for basic materials is a relatively low volume ETF: SMN. Low volume can sometimes mean a gap in stop level and actual trade level. Trader beware.
On the flip side, the main advantage for this sector is two-fold: Dollar (interest rate) sensitive and a laggard: It’s one of the poorest performers of the major sectors and therefore a good candidate for short positions.
By now, we all should be aware that the long-bonds have already tanked (rates up significantly) and with the Fed meeting coming up in December, Intra-bank rates may rise as well.
The risk is that it all gets out of control (as if it’s not already) and rates rise dramatically.
In such an environment, short positions in rate sensitive sectors may have the best opportunities.

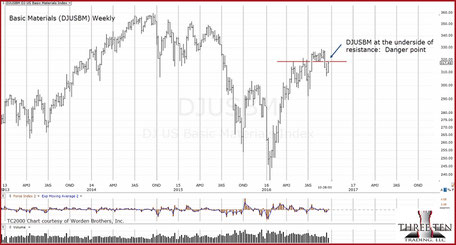
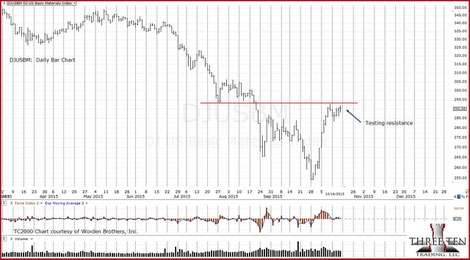
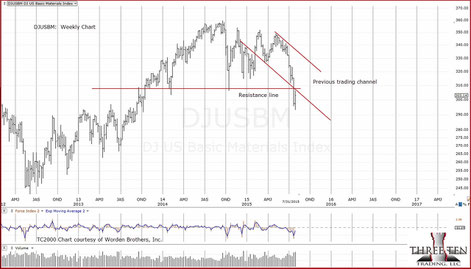
11/14/16: Basic Materials At The Test
Where have we seen this before?
Although not an exact repeat, price action in GDX was similar just before its meltdown of the past week.
The key question of course is, will price action hold above resistance at the test?
Note the DJUSBM chart is weekly and GDX was daily. So, the time frame is stretched out a bit. It may take longer to find out if the test fails.
Even so, going short at this location is definitely at the danger point where the risk is lowest. We’ll know soon if the trade is viable.
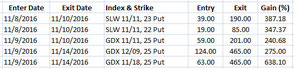
The following list details the recent options trades initiated and closed, taking advantage of the GDX up-thrust.
11/14/16: Basic Materials, Entered Short
12:34 p.m. EST, Basic Materials never recovered from the 2009 meltdown. That is unless you count the new high of 2.05 pts., made all the way back during September of 2014.
At this point, the sector price action’s similar to GDX just before it went into its major rout.
- Note: We just closed out all short positions in GDX, thus minimizing time in the market and booking the profits.
The inverse fund for basic materials is SMN. This fund is not a popular one and volume is typically light. That means a stop order may not be executed at the exact price specified
However, we are in a minimized risk condition with price action at the danger point. Therefore, the liquidity limitations of SMN are going to be accepted.
Entered short DJUSBM (long SMN), with a stop in vicinity of SMN, 23.08
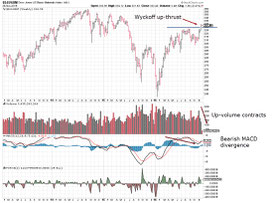
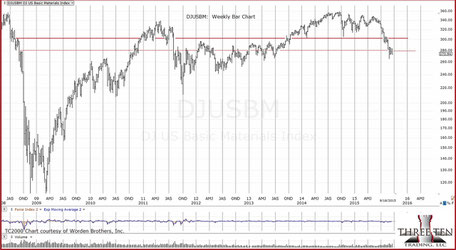
9/22/16: Basic Materials Danger Point
Basic Materials is testing its breakdown … now. Price action is at the underside of significant resistance and puts this market at the danger point.
The largest caps of this sector include DOW and DD. Both of these entities are sensitive to a rising dollar environment (as they have stated in their quarterly reports).
Price action correlation to the dollar typically runs opposite: Dollar up, DJUSBM down.
One of the inverse funds (ETF) for this sector is SMN: We are currently long SMN as noted here.
Through what has been a long process of iteration, the sector that looks to be the most vulnerable to a rising dollar and declining overall market has been identified: Basic Materials
It's an absolutely boring sector. Unlike gold, the S&P and bonds, this sector seems to be ignored ... as evidenced by the very modest volume in the inverse ETF, SMN.
However, using the tenets of Wyckoff, we can see that during the S&P topping process (if indeed the S&P turns lower), this sector is the weakest; weaker than real estate. That sector's ETF (IYR) has a twice the yield of the corresponding DJUSBM sector (IYM).
During a rising interest rate, rising dollar and declining economic condition environment, we expect that dividends will be cut ... further accelerating the potential decline in DJUSBM.
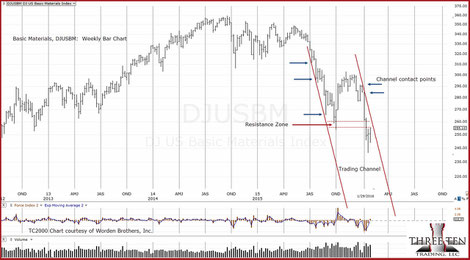
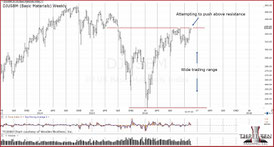
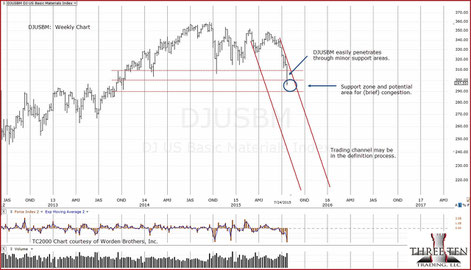
1/30/16
Basic Materials is holding within a trading channel as shown.
This coming week may see more labored attempts at the upside. However, as shown, the index is likely to run into resistance if there is a push higher.
Our long term forecast for the sector is here.
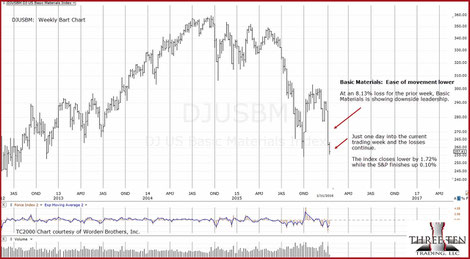
1/11/16
Basic Materials maintains its downside leadership.
Last week's loss was the largest in percentage terms since its high during the week of 9/9/14.

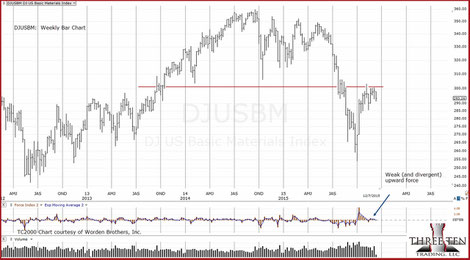
1/10/16
The New Year's assessment of Basic Materials was correct.
Just one week into the month and the index is already down nearly 8%. Bad if one is long. Good if one is short.
The right side of the channel appears to be nearly confirmed.
If there is an upward test that fails and reverses, then we have an excellent short opportunity to follow ... all ... the ... way ... down.

1/2/16
Of all the major indices, the S&P, the Dow, Nasdaq, and Real Estate, it is Basic Materials that is in the weakest position.
The Basic Materials index (like the rest of the indices) is in position to begin the New Year on a down note. The chart of the index shows a potential trading channel.
The demand side of the channel has been established … now we are looking for the supply side.

12/22/15: 3:31 p.m. EST
The Basic Materials index may be in the process of verifying the right side (supply side) of the trading channel as shown.
Price action decisively penetrated the 285.50, support area during the week of 12/18/15. It is now coming back up to test.

12/14/15
Basic Materials has clearly reversed from resistance.
Note that since the overall market has reversed (S&P), with the two largest cap (DOW, DD) of Basic Materials executing an up-thrust, the downward potential appears significant.
12/9/15: 9:44 a.m. EST
DJUSBM update here.
12/7/15
The weekly chart of DJUSBM, does not look good ... unless of course, one is positioned short.
Months ago, Basic Materials was identified as a weak sector.
If we are about to enter another market down leg, one of the objectives will be to determine if this sector is maintaining its (previous exhibited) downside leadership.
11/26/15
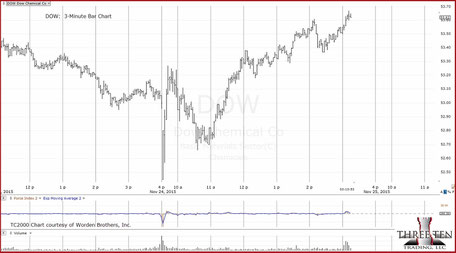
The following is an exact transcription (with chart) of my own personal trading-log notes concerning DOW (Chemical).
Begin transcript:
11/24/15
3:14 p.m. EST
DOW has volume showing up at breakout area > 53.60
4:04 p.m. EST (after the close)
30-min time frame shows both DOW and DD in up-thrust condition.
DOW has the largest downside volume.
9:29 p.m. EST (Follow-on notes)
The 30-min to hourly for DOW shows the beginning of an up-thrust – it may or may not culminate into a reversal.
The 53.75 – 53.80 resistance area has been in place since 9/26/14
DOW closed at 53.38
The 30 – 60 [minute] – 2hr bar charts show that price-action has retreated back into the trading range.
End transcript
The chart then
The chart now
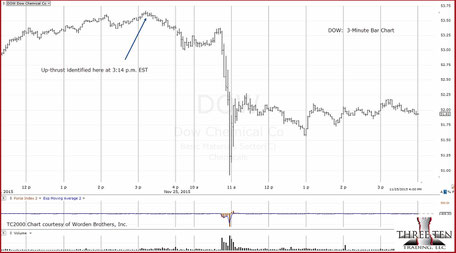
At the 2009 low, DOW posted 5.89. Financial, economic and world wide conditions are much worse now then at that time.
This helps to keep it all in perspective ... that the ensuing move, whenever it occurs, has the potential to breach previous market lows.

11/1/15
On a weekly closing basis we see that the Basic Materials sector has rallied back up to test resistance.
Upward momentum has dissipated and the market appears in position to move lower.
Full technical details at this link.

10/24/15
Basic Materials has managed to get itself back up to resistance.
Unlike the S&P, this index is far, far away from its former highs. In effect, Basic Materials is one of (if not the) downside leader(s).
The overall market continues to thin-out which is a typical late-stage bull market (topping) event.
It should be noted, the index has rallied in the face of a strengthening dollar.
From a fundamental standpoint, a stronger dollar and a stronger Basic Materials (whose components incorporate a significant international presence) are not coherent. Corporate earnings may/will be significantly impacted if the dollar persists in its rise unless those corporations incorporate currency hedging.
Even if they do hedge, there is no assurance that the in-house traders will select and maintain the correct side of the trade.
Specific technical details and forecast on what may be expected are here.
10/16/15
Along with the S&P, Basic Materials is also pushing up against resistance.
Another opportunity may be at hand.
Detailed technical discussion and additional notes here.
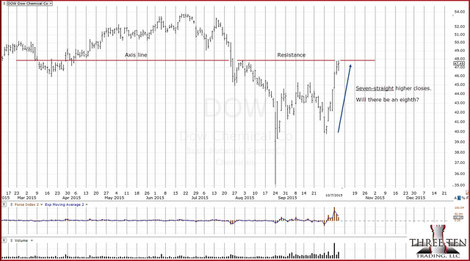
10/7/15
Seven higher closes in a row. What is the probability of an eighth?
Sharp moves like the one at left are more typical of short-covering than an all out bull move.
Additional notes at this link.

10/5/15
DOW (Chemical) is in up-thrust position.
In addition, today's volume was the third highest ever for the stock. This is a potentially significant event.
Details on the technical analysis and its implications are at this link.

9/23/15: 11:41 a.m. EST
Position update on Basic Materials at this link.
9/19/15
The DJUSBM has been oscillating at each axis line or support zone. Price action continues lower.
The current axis line is the one with the most price action activity and thus defines the strongest support level. A decisive penetration of this area and a move lower implies significant downside potential.
Fibonacci projections for the index are at this link.

9/3/15
DOW is the largest component in the Basic Materials Sector.
It continues to maintain a downward trading channel and looks to have contacted the right side today.
Additional details on DOW price action are here.

8/29/15
We can see that DJUSBM is adhering to the channel that has been in effect since early July.
Now that the bounce appears to be over, continued downside action is anticipated.
Additional detail on the price action is here.

8/18/15
Looks like DJUSBM is about to continue its trend.
Of all the market sectors (other than commodities), Basic Materials has been one of the best leaders to the down-side.
Position notes for this index are at this link.
Initial targets for the index are shown at left.
Depending on if/when and how fast DJUSBM moves to these levels, will determine if other (lower) targets are evident.
Position notes for the index are at this link.
We see that the DJUSBM held a brief downward trading channel before falling to lower levels.
The past week has been a tepid rebound to test the underside of the resistance line as well as the underside of the previous channel.
If the trading channel shown at left is in-effect, then price action may move exceedingly fast going into the fall months.
The basic building blocks of economic activity have broken to the down-side.
With every bear market, there is a down-side leader.
Basic Materials looks like it may one of the sectors that leads the way to lower levels.
Position details are in Market Action.