
Gold & Silver

9/4/17:
H-Bomb Detonates … Gold “blips” less than 1% higher
We get a verified 6.3 magnitude quake (by USGS) and possible nuclear detonation: All gold can do is manage an anemic blip higher.
Gold bugs may be very worried at this point. That $5,000/oz - $10,000/oz, mark seems a long way away.
We’re still at the danger point (although it’s getting a bit stretched) as far as gold is concerned. However, world events are far from benign; it appears that gold is not acting as the bulls would expect.
If it’s not behaving properly to the upside, the overall direction may still be down. Gold may be waiting for that last ‘investor’ to buy in before a reversal.

8/31/17:
Gold Hype Ramps Up
Exactly one month ago, our report on “gold hysteria” indicated that we should prepare for the pontificating that would be prevalent if and when gold made a breakout.
Well, here we are. The list below is but a brief accounting of the bullish posturing over the past two days:
Gold bear market is officially over.
Gold to go to $10,000.00
Gold to go to $5,000 then to $10,000
Not a single one of these links contains a chart of gold or anything that resembles even a stab at analysis.
With that said, it’s obvious at this point (because of all the hype) that gold is at the danger point: The point where price action can go either way.
A quick look at Andrew Waldock Trading, shows he’s keeping mum on the precious metals … at least the information that’s released to the public. Of course, he’s not obligated to discuss any of his proprietary research.
A fight as big as this in the gold market, is not likely to resolve itself in a day or maybe even a week.
However, looking at the 3-Day chart of GLD, we see that today closed just 0.01 point higher than the opening three days prior (suggesting a possible reversal)
It could be something or not … we’ll have to see what happens next. However, given that gold has not exceeded the July and August highs of 2016, it’s a bit of a stretch to say that the bear market is ‘officially over’.
Meanwhile …. the dollar goes into its ‘test’ and bonds are hovering at resistance.
It’s all happening simultaneously.
Gold (GLD) Then and Now: 7/10/17 - 8/28/17


8/28/17: Gold, Then and Now
As forecast nearly two months in advance, gold is now in up‑thrust position.
The chart of GLD from the July 10th update is provided side by side with today’s action. Use the arrow key to toggle between the two images.
As Wyckoff said a century ago, ‘The most desirable thing in all of Wall St., is to know what happens next.’
Well, that goes for then (July 10th) and now, August 28th. At this juncture, it’s clear that gold is at the danger point where the risk is least.

8/27/17:
Gold What?
Dollar down and gold's not soaring higher? It’s all so confusing say the traders here and here.
We’ve already given a heads-up the dollar may penetrate support and create a spring condition. All that’s missing is the move and the media hysteria.
What about gold. What’s so confusing?
Taking a look at the monthly chart of GLD (gold proxy), it seems obvious to us. Gold is hitting the upper side of a trend channel that’s been in place for nearly five years.
Even if the metal does break out to the upside, markets typically have patterned movement and a test of the down‑trend would be expected. If that happens, it would be a good time to assess going long.
In the meantime, expectations are for the professionals to be selling and selling short into the advance with a subsequent reversal and a move lower.
Not much confusion there. If this firm (or its founder) is ever interviewed on TV, take the opposite side of the trade. J

7/15/17: Gold And Miners, The Battle Lines
Identifying a high probability set‑up requires that one know where the battle lines are drawn.
Here’s a peek into our command center; revealed in notes made on two charts of Newmont Mining (NEM).
On June 13th, the area for an up‑thrust was identified. The overall expectation is for a continued decline in gold and the gold mining shares. That long term direction is obviously the complete opposite of what’s peddled in the mainstream.
To get to the up‑thrust condition (if it happens) requires fuel.
We can see that by penetration of the support low in the area of 32.00, NEM generated a spring set‑up. The amateur longs were washed out (maybe even going short) and the professionals moved in at a low risk point.
After all, it’s the pros that have enough money to drive NEM into an up‑thrust. They would then take the opposing side as the press would likely be hysterical about the “breakout to new highs”. Just a reminder on how this game is really played, can be found here.
Additionally, the spring condition was also highlighted in the gold update of 7/10/17.
As always, anything can happen and set‑ups can fail. However, if NEM manages to get itself to 36.00 and then stalls, it may yield an excellent medium term (strategic) shorting opportunity.

7/10/17: Gold at Danger Point
The weekly chart of gold (GLD) has price action penetrating support and stopping dead.
Sentiment has come off its highs and thus provides a pessimistic backdrop for a rally.
Years ago, David Weis commented on how a spring set-up has a tendency to go straight into an up-thrust.
That's our expectation. We'll continue to monitor for a shorting opportunity if/when GLD makes it to the up-thrust zone.

5/23/17:
Gold Nearing $1,300/oz. Resistance Level
We’re coming up on one year since gold attempted to breakout to the $1,300 up‑side. This article sums up the typical attitude at the time. Remember, the mainstream does not trade. They are not paid to be right, only to give the public what they want.
Back then, while gold was moving higher, Andrew Waldock reported the mining sector was selling forward (selling short) gold contracts like no other time in the history of the index. The miners did not believe the hype about stratospheric gold prices and were all too happy to let the “customer” have what they wanted.
Well, nearly a year later that ‘customer’ is still under water (GDX down 28%) if they had bought at that time… still waiting for the hyper-inflation … still waiting … and waiting.
It’s all reminiscent of the ‘for sure’ rally that was to occur in the uranium (U308) mining sector. Remember that one? It was a pundit-fest and SeekingAlpha click-bait, cash cow as well.
Coming back to the present, we have reports just out about how one quarter of the U.S. population can’t pay their bills and that 45% or so, can’t come up with $400 in cash. Topping it all off, U.S. consumer debt is at all time highs … even higher than 2008.
So, we have to ask ourselves … just where’s the capital going to come from to drive the price of gold (and the miners) higher?
It could come from sovereign nations or maybe big trading firms … but those entities have been able to stockpile for years ... and yet there’s still no hyper-liftoff.
When we’re talking about large entities such as sovereign nations or massive trading firms and banks, we have to look at the charts using their language; the language of the long time-frame; the quarterly chart.
When’s the last time you saw a quarterly chart on a mainstream financial program? Our guess would be never.
Quarterly charts show the lumbering flow of the really big money. In the chart of GLD, we see that just as the miners suspected, high prices did not last.
Now, after the break lower, GLD has been working its way up over the past two quarters to test the underside of the $1,300-level.
Of course, what happens next is the important part. Do we think the behavior of the miners and their trading desks are going to be any different this time around?
Well, they could change and we’ll certainly be monitoring for that. However, we can already see this quarter’s bar is posting shorter as it approaches resistance. It’s a sign of flagging momentum.
The expectation then, is for gold to stall at resistance and then reverse; Maybe after a period of congestion or maybe not. It all depends on the price action

5/13/17:
Gold miners follow-up:
Three sessions later
Another example of Wyckoff analysis calling a price action move to-the-day.
Even after more than a century, Wyckoff is still the best tool (not algorithms, IBM’s Watson, or any other) for identifying what is really taking place in the markets.
It takes experience and human … actual live human knowledge and intuition to perceive market truth.
The fact that so many continue to hold false belief that prices move based on fundamentals and financials, shows that Wall St.’s centuries-old deception still holds the average investor in a psychological vise.
Livermore said it himself in 1921. 'The main purpose of Wall St. is deception'.
Still not convinced? Try this.

5/9/17:
GDX (gold miners) in spring position

1/6/17: Gold Forecast To Move Higher
If gold is in a counter-trend move and bleeding off negative sentiment, testing of resistance underside may take the form shown in the chart.
The importance of the forecast is not the forecast itself as anything can happen. The forecast helps us avoid counter-trend trades (unless that’s your method), while the move is working itself out.
We already had a huge trade with the short of GDX last year. The recent short of SLW was profitable but did not perform as expected. It’s time for us to stay away from this market (gold/silver and the miners), until the corrective process is finished.

1/3/17: SLW, Up-Thrust Test
The SLW Put was entered at the up-thrust (on 12/30) and the OXY Put was entered at the up-thrust test during today’s session (chart forthcoming).
The concept of market “testing” was for me, a difficult and frustrating one to accept. David Wies in his Trend Reversal video discussed the fact that markets “test”. That’s just what they do. A test can pass or it can fail. One needs to be prepared for each outcome.
It’s interesting that price action for SLW and OXY (both commodities) is currently at that “test” location. If the set-up does not fail, then expectation is for re-assertion of the down-trend.
Personal note: Before contacting Daivd Wies requesting him to be my mentor many years ago, I watched his video approximately 50-times and studied every nuance of his analysis … all the way down to his voice inflections.
I then searched the web for any published articles and purchased those as well. More study.
Then, weeks later and with fingers trembling on the e-mail send button, I let him know the depth of my research and contacted him for mentoring sessions …. which he accepted.
Getting counsel from him was the culmination of nearly 30-years of market search and study … I finally found the person that knew how to dissect the market. He was the expert in a method (kept quiet by Wall St.) that was a century old … Wyckoff.
p.s. That "replay-it over and over" you read in the video description is his reference to me.

12/30/16:
NEM upgraded to a Buy rating .. so look to short (SLW is the sleeper)
Newmont Mining upgraded to Buy from Standpoint Research. So, what’s our first response? Look to see if there's a short opportunity … of course. J
Looking at the P/E listed in MarketWatch, we see NEM is around 693 … nosebleed territory.
There’s a better one and it's Silver Wheaton, with a P/E at 4,125 … that’s right, a P/E over four-thousand.
Turns out SLW price action is weaker than NEM … the fundamentals have been confirmed by the price action.
SLW needs to get above 20.51 (in our view), before it becomes an opportunity to investigate further. That could happen during today’s session.
After the close: SLW finished at 19.33, below our stated 19.60 level.
Update: 11:14 a.m EST
SLW punched through 20.51 to a high of 20.89. Put option (SLW 1/27, 20.00) purchased at a contract price of 0.78.
Looking for an SLW close below 19.60 (otherwise position may be closed)

12/23/16: Seabridge Gold: Watch List
Overview:
Seabridge has one of the largest undeveloped gold reserve projects in the world.
The company fully owns the KSM project in Canadian British Columbia. KSM has approximately 40-million ounces of gold in “reserves”.
Reserves are ore that can economically be extracted.
- That amount of gold equates to $46-Billion at a gold price of $1,150/oz.
- Management and insiders hold over 30% of the shares outstanding.
- Mine life potential has been determined to be 55-years.
- SA has completed the approval process (December ’14) required by the Canadian government to proceed with development.
- Although undisclosed by the company as to who they are, the major mining operations are interested.
Analysis:
We have been watching SA for some time. Price action is currently at a Fibonacci projection level. It’s possible that we're at a pivot. It’s also possible that it’s only a temporary lull while on the way back to the 2.00 level.
Price action itself will let us know …. watching SA closely.

11/22/16: GLD May Test Resistance

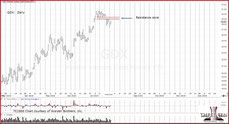
11/22/16: DUST Position Closed. Initiated Long SRS

11/20/16: GDX, Miners Set To Head Lower
Price action tends to alternate. What happened before will not happen now. If there was a complex correction prior, expect a simple one now.
That’s where GDX is at this juncture.
Gold appears to be in or completing a dead-cat bounce and if so, will head lower swiftly, taking GDX right along.
The next support level is significant. One would expect a complex correction (before heading to even lower levels) to ensue at that location.
Complex, simple, complex.

11/18/16: Gold, "Dead Cat Bounce"
If gold (GLD) makes a new daily low (and closes lower), it may be headed to the next lower Fibonacci level … a long way down from here.
If it manages to hold and close higher, then we may be in for an underside test of resistance at the 118 – area.
With so many on the wrong side of this trade, a move higher to test may not be in the cards.
The swift move down has caught the general public off‑guard (no surprise there) as evidenced by this video. There seems to be confusion about the gold rally evaporating.
If there's continued “dead cat bounce” buying at current levels and it does not work out (prices continue lower), it just adds more fuel for a price rout.

11/11/16: Gold, The Big Picture
The pundits have succeeded in getting themselves and the public completely on the wrong side of this trade.
The last gold bull probably and dutifully went long the day after the election (11/9). After all, he was told to do so. The mantra was: ‘Gold’s going higher no matter who wins’. Really?
Assessments like that are as useless as “Every reaction should be considered a buying opportunity”: That uselessness applies anytime ‘insight’ like that is offered up in any market.
Indeed, gold did go higher in the overnight futures market. However, by the time the regular session opened November 9th, that gain had been erased: Not only that, massive volume was posted on the reversal.
Volume like that signifies a changing of hands from weak to strong. The big players are in position and most likely on the short side.
While the S&P may grind around a bit at the trend-line underside shown here, gold is already leading the way down.
How can it be? Well, at the risk of attempting a false “narrative”, let’s give it a shot.
With the election of Trump, it’s likely the money printing extravaganza that’s been going on since 2009, is over.
That means, in spite of all that printing, gold only made it to $1,900/oz before reversing. It never came back … and now, the tailwind may be gone for sure.
The average investor has been coached into loading up … for nearly a year! It’s a Wile E. Coyote moment.
Meanwhile back at the Wyckoff ranch, we’re looking at facts and not narrative.
At this point which could always change instantly, facts are that gold has reversed from an up-thrust condition.
The only correct action (other than standing aside) is to be short and stay short this market until it shows a change of character.

11/9/16 (1:04 p.m. EST):
GDX Fails The Test
It’s mid-way through the session and the verdict is in.
GDX price action can’t hold above resistance. This is a text-book case of up‑thrust (false breakout), then test and now, potential swift decline.
The market continues to decline even as this post is being generated.
Of course, silver and gold are supposed to be the safe havens. We have well respected pundits calling for inflation or hyper-inflation. It’s a believable theory.
The problem is, price action is not co-operating (at this point) with that theory.
It’s very early in this test move. Anything can happen by the close.
However, if we look at the dashed blue trend-line on the chart, it measures straight-down: -100%, annualized.

11/9/16: Market Theory, GDX
The theory behind the “test”
All the way back to Wyckoff’s text in 1910, he provided timeless insight.
‘Wherever the market spends the most time, defines the direction of trend.’
At the up-thrust., we see approximately four days of trading above resistance: from 11/1 – 11/4.
At the test, there's not even one day above that level. In actuality, the time spent above resistance was approximately two-hours.
The market has defined the direction of trend. The second attempt above resistance could not hold. Unless conditions change and additional demand materializes, the direction of trend is down.
In the case of an up-thrust or a spring, instability is created. Price action enters a level that can’t be sustained. After such an event, forceful moves in the opposite direction are to be expected.

11/9/16: GDX to Test Resistance
The overnight session in gold and silver provides an excellent opportunity to position short.
The mining sector ETF, GDX has swapped positions with SLW in the case of weakness. GDX now appears to be weaker than SLW.
GDX posted an up‑thrust last week. If price action holds and opens in the range shown, it may post a test.
The big picture is a silver and gold short covering on a massive scale (taking nearly all year). The conditions appear to be coming together to validate that premise.
If the test fails to penetrate and hold above resistance, we can expect a swift decline to follow.
That decline will likely take down all those looking for a ‘safe-haven’.
To borrow a quote from Les Brown: “In life, there is no safe position”

11/8/16: Gold Leading The Way ... Down
Buy the rumor. Sell the news.
While the S&P still appears to be in the ‘buy the rumor’ stage, gold’s already leading the way down.
There may be some retrace activity throughout the day to get a 38%, or 50% level. However, both of these levels are below the resistance area where the up-thrust (and trend contact) occurred.
One can develop their own trading plan from this data. It’s true that anything can happen and gold could mount a rally after election results. If that were in the cards, we’d then expect a retrace rally (today) past the 50% area, and back above up‑thrust resistance.
We’re still looking at SLW, and it appears that a low risk short opportunity may be at hand.

Chart by StockCharts
11/5/16: Silver Wheaton (SLW): Bearish
Friday’s action in GDX was effectively a “probe” of the market. Not dissimilar to the probes discussed by Livermore in Reminisces.
The expectation was for a weekly close below the prior week’s resistance (24.93), which did not happen.
When it became obvious we weren’t going to get the close desired, the trade was exited with a small profit. The trade criteria were defined before the entry as re-stated here:
If GDX closes in the lower half of its weekly range, somewhere around 24.20 – 24.40, maybe even 24.50, then it will be difficult for subsequent price action to mount another rally attempt.
GDX did not meet the above criteria and the trade was closed.
The best way to demonstrate the price action that was envisioned is to show an example that performed as intended.
The notations on Silver Wheaton (SLW) are exactly what we envisioned for GDX. Therefore, the market is telling us to shift focus to SLW.
As a side note, it’s important that pundits have come out with ‘Gold’s going to skyrocket after the election’. Potentially false narratives like this help to set up the conditions for a trade. If we don’t have such admonitions, it lowers the probability of success. The majority must be on the wrong side. It’s been this way since the inception of the markets.
As this ‘skyrocket’ talk will likely continue on into Tuesday of the coming week, it gives an opportunity to position on the short side. The market for silver and SLW, is already set up in a bearish condition.
Since we don’t like to short individual equities, the alternative is to go back to the options market. Options (buying them) have to be timed so precisely that it must be done typically at
mid-session or towards the close as a counter-trend move is nearing its end.
Purchasing options in this way allows for the possibility of having time to get out with a small loss (as opposed to a total loss) if the trade premise does not work.

11/4/16: Gold at Danger Point
Gold may be testing the upper side of a trading channel.
If we take our cue from other commodities such as natural gas and oil, both have reversed lower.
With more money printing than has ever been seen in the history of the world … and within that context, gold can’t seem to get (and stay) above $1,300.
This is the danger point where price action can go either way.
If gold manages to punch through the channel barrier, it opens the door for a test of underside resistance at $1,400 - $1,500.
If not, and gold declines from here. The probability then becomes a move to much lower levels. Those potential levels will be assessed based on price action.
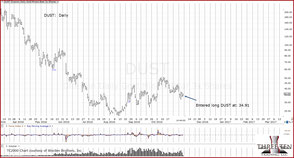
11/4/16: 3:51 p.m EST: Discretionary Exit on DUST at: 35.24

11/4/16: GDX at Weekly Resistance
When markets get intense and highly emotional, they tend to exhibit well defined Fibonacci characteristics. Note the 13 weeks from high-to-high.
Certainly, one can tell with all the gold analysis available, the market's highly emotional with players not rational nor counter‑intuitive.
Our view is that from the outset of this gold and miners spike higher (starting early this year), there’s been the sneaking suspicion the entire move may just be a short‑covering rally on a massive scale.
We may be about to find out if the “short‑covering” theory is true.
If GDX closes in the lower half of its weekly range, somewhere around 24.20 – 24.40, maybe even 24.50, then it will be difficult for subsequent price action to mount another rally attempt.
As noted earlier, we are short this sector via DUST and in the green at this point. Stop for DUST is the session low at: 34.42

11/2/16: Gold (GLD) Underside Test
Let’s re-visit the gold analysis made on October 10th:
What we’re looking for, and what may lead to a low risk short (gold or gold miners) entry, is how price action behaves on a move back to test underside resistance.
That type of move is not guaranteed of course. However, after observing the gold and silver markets for thousands of hours, we've noted that after a significant break (either up or down) price action tends to come back and test.
In the current case, a test move may take some time (possibly several weeks or longer, if at all) given gold’s current punch-drunk condition.
Gold has done exactly that. It's taken four weeks to come back to resistance for a test.
There's a price level that will effectively define if gold has a probability to continue higher into the 1,500 area (141 – 151, in GLD), or if the breakdown four weeks ago was the kickoff to much lower levels.
That price level is shown: 125.46. Penetration of that level increases the probability for a move higher.

10/10/16: Dead In the Water
At this point, gold looks dead. It took a severe beating last week and it's not showing signs (at this point) of a quick recovery.
What we’re looking for, and what may lead to a low risk short (gold or gold miners) entry, is how price action behaves on a move back to test underside resistance.
That type of move is not guaranteed of course. However, after observing the gold and silver markets for thousands of hours, we've noted that after a significant break (either up or down) price action tends to come back and test.
In the current case, a test move may take some time (possibly several weeks or longer, if at all) given gold’s current punch-drunk condition.

10/7/16: Gold Breakdown
Pulling out to a long time frame, quarterly, we see the large money flows into and out of gold.
Note how the quarterly bars shortened as GLD approached the 130.00 level.
Shortening of the thrust is a Wyckoff tenet telling you a move is nearing its end.
At the quarter just ended, we see a short bar indeed. In fact, this bar is the shortest quarterly percentage move in over 12 years! There is a lot of resistance to getting past the 130.00 level.
If or when GLD moves lower and approaches the 100.00 area, it may penetrate that support and set up a measured move to the 75 – 80 level.
Of course, the media and pundits alike seem to be surprised. In fact, we now have the ‘buy the dip’ crowd giving us sage advice. Well, if this crowd did not forecast a move lower, then how would they know what's likely to happen next?
If gold is to move (significantly) higher from here, it has to struggle against both momentum and resistance.
It’s true that silver and gold may move significantly higher at some point. However, it's likely to wipe out a large contingent of ‘investors’ along the way. The time for us to consider gold is when it’s in the streets and former investors are selling it en masse.

9/22/16: Gold To Push Higher?
Gold looks like it’s setting up to target the 38.2% retrace area. A wedge has formed over the last three months, providing a measured move target.
The 38.2% is significant resistance and not likely to be broken on the first attempt.
If or when gold gets to this level, it may be in the construct of rising interest rates and a rising dollar. There may be significant headwinds to reaching higher prices.
In addition, the commercials have shown the willingness to sell, sell, and sell some more (go short at historic extremes) at current prices. Collectively they have indicated no indication to join the ‘hyperinflation’ camp just yet.

9/17/16: Gold Upside Fails
As identified in the 9/4, update below, a decline in GLD is expected.
If gold is to move down from here, few (except the commercials that have positioned short) will be expecting lower prices.

9/4/16: Gold Decline Appears Imminent
The chart of GLD shows that it's still a bear market.
If the wedge pattern is in-effect, if the view of a bear market bounce proves correct, then gold may be set for an unexpected and swift decline.
We have already noted in previous posts (the Waldock report), the professionals, those that work the industry have shorted (sold) into this market at an all-time historic extreme.
- Note: The barchart.com link to the Waldock report has been deactivated.
- While we have copyright approval from Waldock to quote him directly, we do not have approval (as yet) from www.barchart.com replicate their data and so can’t provide a reprint. However, we do have Waldock’s report safely stored in our corporate data vault.
At this point, the professional’s (commercials) view is coming into focus. This next week may help to clarify what looks to be a pivot point for the metal.
If the long term trend is still down, then impulsive (ease of movement) price action lower is the expectation. Our response has been to position short the sector via DUST; the status of which can be viewed at this link.
Stop levels are proprietary and detailed here.

9/2/16: GDX Testing Resistance
There are times when turning a chart up-side down helps with interpreting price action. 'Inverting' is an old technique with no officially documented source (as far as we know).
With the chart of GDX inverted, we see it has decisively penetrated support (resistance non-inverted) and has failed to hold the lower levels.
This week was essentially a test of the support level. Note that price action made very little encroachment into the prior week’s range; a sign of weakness.
The worst case scenario the mainstream media can come up with is that gold is correcting in an otherwise bull market. That (potentially false) narrative takes no account that GDX has failed to hold above long-time resistance.
The resistance area (27.50) is significant as it has been tested (a form of verification) no fewer than three times on the weekly charts.
Additional details on GDX price action are here. Stop location(s) for the DUST position(s) are here.

9/2/16: GDX Tests Underside
As expected, GDX has tested the underside of the trend. Our plan was to wait and then position short (via DUST) as discussed here.
The stop placement is tight should the position fail. Stop placement details.

Gold Penetrates Support And Stops Dead: 8/31/16
We’re at the danger point. Provided that GLD does not move lower during this session, the thrust below support is minimal.
From a trading standpoint, gold (GLD) is now in spring position.
We have an updated blog post (password protected) that shows our expectations and potential trade actions for a move higher in gold (GLD) and GDX, should it occur.

Gold and gold miners: 8/23/16
For gold and the gold miners to continue a rally, they need to decisively penetrate resistance.
What we can see for both, it’s not there. They have stalled.
At junctures like this, typical market action is to decline to a prior support level and then attempt another rally (if we’re still in a bull market).
If this is actually a reversal, the risk is least at this point. However, going short (via DUST or DGZ) would be exactly opposite the consensus analysis of a ‘surge into gold’.
Has that surge not already happened?

7/30/16: Gold in Danger
Gold is at the danger point:
No one expects the price of gold to decline … save a tiny few in the minority.
Yet, gold is at the ‘danger point’ condition that Livermore and Wyckoff discussed all the way back in 1921.
Let’s see if those ancient analysis techniques still apply to our new age situation.
7/27/16: GDX Bull Trap
The gold miner ETF (GDX) may be able to get itself into an up-thrust condition.
In the pre-market, GDX is trading at 28.78 (+0.280) and near the resistance level identified.
If the resistance area is penetrated, then we are at the danger point. Price action could go either way.
Password access details (and blog discussion) are here.

7/26/16: Goldcorp (GG), Bull of the Day … Really?
Here is a link that is distributed to the public with an assessment of the current gold, and gold miner markets.
So many assumptions (with no supporting references) made in the podcast to list. Here are just a few:
- Money moving out of British Pound to the dollar
- Anti-fiat money trade pushing gold higher
- Unspecified ‘macro’ events must be driving gold higher
- The list goes on …
Even a cursory look at the chart indicates that not only is GG not bullish, it’s at an inflection point that may lead to lower levels.
7/20/16: Gold Bulls Target: $1,500
Upward predictions are standard fare during a bull market. The problem with gold is, it may be in a bear instead.
Bear market rallies are sharp and at times near vertical. We certainly got the 'vertical' part on the Brexit vote.
If there is to be a significant reversal in any market, there needs to be widespread belief that it can't happen ...


4/17/16: Tom McCellan Joins Gold Bear Side
First, there was Andrew Waldock. Now, Tom McCellan indicates bearish potential in the precious metals. Position updates.
3/14/16, Before The Open: On Cue ... Gold
As if on cue, Andrew Waldock of Commodity and Derivative Advisers (whose assistant provided input on the Flash Crash update), has presented his analysis of the gold market.
As stated in the Weekend Update: The situation looks like a good short opportunity.
Meanwhile, back at one of the weakest sectors, a Biotech chart update is here.

4/4/16: GDX Erosion Continues
The commercial traders are short on gold and it’s starting to show in the mining shares as well.
Even at this juncture, additional demand could materialize and push prices higher. However, with each passing trading session following the “script” for a slow (nearly imperceptible) erosion of price, the market is indicating a potential top and reversal.
Charts by StockCharts

3/29/16
When price action is oscillating around the edge of a range or trend-line, that is the exact time to establish positions (either long or short).
On the short-side we see that GDX (and the NEM proxy) have come back up for a test of the trend-line.
Note the apparent loss of up-side momentum. Not a good thing to lose when attempting to break a multi-year trend.
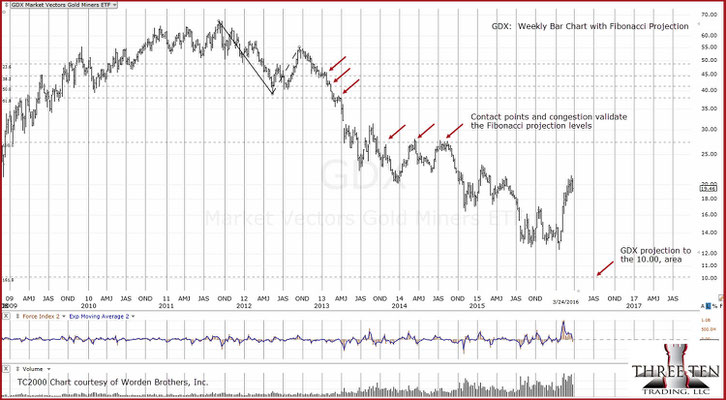

3/25/16
The two charts of GDX present the current situation in the gold sector.
The chart on the left shows what appears to be an unfinished downward move to the 10.00 area. The chart on the right shows GDX contained within a multi-year trading channel. It also identifies two similar areas of price action behavior.
At this link, we have an Elliott Wave analyst indicating higher prices ahead. So, there is an alternate view to the gold market juncture.
Also note, the last time Andrew Waldock presented data on commercial traders heavily short, was at Point No. 1. That itself should give the gold bulls pause as he just reported heavy commercial short positions at Point No. 2.
If the market moves higher, the tracking account short position has a stop that will ensure a profitable trade if stopped out. The objective is for profit even if proved wrong.
However, if the market follows the bearish projections, the ensuring move will likely catch most participants off guard (as evidenced by the Elliott Wave forecast) and may lead to a significant and long lasting capitulation in the sector.
If and when that happens, that may be the time for aggressive long positions

3/23/16, 2:01 p.m. EST
The chart of NEM shows the sequence of an up-thrust. First, we have a labored approach into resistance.
Then, we have an attempt at new highs. This attempt is the danger point. There may be a breakout or not. The risk is lowest at this juncture.
Then we have indication of a failure … with confirmation and a move that breaks lower.
The wide price bar indicates a potential area for a test. Reference must be made to David Weis for this market hint. In our opinion, there is no better traditional (Wyckoff based) market analyst still living.
To summarize his words, ‘a wide high-volume price bar tends to be tested’.
We will see if NEM (and the corresponding GDX) gets to this level. Either way, price action will be analyzed throughout.
Note: Short positions established at the previous session as well as current: Details here.

3/22/16
Newmont has spent the last four sessions attempting to break to new highs. At this juncture, that attempt appears to be failing.
When price action is at the danger point, it can go either way. This location (danger point) is the lowest risk area of a trade.
If one is wrong on the direction, price action does not have to travel far to invalidate the trade. Thus, losses are minimized.

3/19/16
With Newmont Mining as the only gold miner within the S&P 500, we can use it as a proxy for the mining sector as a whole.
Newmont has reached the “danger point”. This location is not the top or bottom of a move. It is the location of maximum stress between the bulls and bears. Price action could go either way.
The danger point (from the data that we have) was first discussed in 1921, during a meeting between Livermore and Wyckoff. Subsequently, in 1922, Wyckoff went on to publish a series of articles that discussed “Livermore’s Methods Analyzed”.
We have price action that is behaving the same as it was nearly a century ago. The market never changes (as human behavior never changes).
Newmont's at a confluence of resistance with weakening thrust energy. The inference is that we are at a downward inflection point.
The psychological factors are all there. The incessant hype by the so-called financial newsletters (and of course SeekingAlpha … how could we forget them). The average investor has been herded into the mining sector which has indeed run up in price thus serving as a lure for even bigger profits.
So, this is it. Either there is a significant breakout to higher highs, or, we get an erosion of successive lower lows … frog in the pot cooking of those on the wrong side of the trade; all leading to an ultimate wash out and real capitulation.
As a final note, Andrew Waldock has posted his assessment that effectively states the professionals (the commercials) are selling, going short into this gold rally like there is no tomorrow.


2/21/16
Before we get into the projection for the gold market, first let’s dispel the myth that gold responds to inflation or hyper-inflation concerns.
Our view is the gold market has become so distorted, it no longer reflects long-held (belief of) inflation/deflation correlation.
Proof of that can be seen in the chart of gold vs. interest rates. We are using GLD and TLT as the proxies respectively.
If gold was responding to inflation expectations, then we would see a correlation of rates higher (bonds lower) and gold higher. In addition, we would not see that correlation deviate for any extended period. The rates higher, gold higher correlation would remain a constant.
Reality (what is, to use a Livermore term) is that there are times rates are lower, bonds are higher (data points 3 – 5) and gold moves higher as well: For a period of over one year! No inflation correlation there.
Then we see that bonds are lower, rates higher (data points 5 – 6) and gold moves lower as well? Again no correlation with inflation as we would expect gold to move higher as rates moved higher.
Then we see bonds moving higher and gold moving lower (data points 6 - 7). This is the opposite behavior as observed with data points 3 - 5. Therefore, we have no consistent correlation between rates and gold price movement.
This non-correlated behavior has occurred over a period of several years. They are not temporary aberrations but an outright indication the rates higher/ gold higher correlation has been decisively broken.
Moving on to our gold forecast: Continued discussion is here.


2/17/16
The chart at left is GLD inverted (2-Day Bar Chart)
It is clear that price action penetrated support on heavy volume and then immediately bounced back.
There have been several days of congestion with the potential of a test lower (higher, non-inverted) although it does not look probable.
The bears have sufficiently hooked the gaff into the bulls and may start to press their advantage forthwith. No time like the present.

2/15/16, 9:54 a.m. EST
A close up of the reversal in GLD shows the climactic volume and subsequent (futures market) reversal below resistance.
If some kind of massive demand comes in and is able to push (and hold) gold above resistance and break out of the three-year down channel, we will of course take note. At this point, price action looks more like a short-covering rally than the beginning of a new bull market.
As proposed years ago (alas, on SeekingAlpha), there will be no sustainable bull market in gold or the gold miners until nearly every single small investor has been wiped out and all bullish talk/recommendations on that sector have ceased. It does not appear that we are at that point ... yet.
Our detailed (password protected) analysis on the gold sector will be released by the end of the week.

2/13/16
There is a reason why we use SeekingAlpha as a contrary indicator.
Let’s think about it: To make money on SeekingAlpha, one has to receive a large number of views: An incredibly large number.
Those submitting articles (if they want to be ‘successful’) are focused on page views. They must have a 'view' focus or their efforts are in vain. That focus on readership and page views is completely contrary to what is actually successful in the markets.
Going back to an analogy from Robert Prechter; Years ago, he stated that if there was a lot of agreement with his proposed market view, he knew that his analysis was wrong.
On the other hand, if he received derisive comments and ‘hate’, he knew that he was on the right track. It is as simple as that. A large number of page views will most likely indicate an incorrect market stance.
So it is with the gold market. Gold is in the news. Correspondingly, SA has articles on how “This is it!” “This is the big one!”
Well, it certainly may be the big one alright but probably not how those on SA think.
Of course, we have to keep in mind all-the-while that a blind squirrel will occasionally find a nut. Those on SA may be right: Most likely, not. If that seems harsh, then let's see the chart. Where is the chart of performance?
This trading entity is out to make money and not to win a popularity contest on SeekingAlpha. As indicated by our own metrics on website "page views" and those with access (via password) we have a limited but doggedly loyal following; By definition, this is exactly as it should be. If this site starts to get too popular, then something is wrong.
With all of that in mind, the chart above is how we see the situation in GLD.
There is a three-year down channel that has been contacted in the past week. The 2-Day shows a reversal. Volume was climactic.
Paradoxically, for a market to have a sustained move, it typically goes in the opposite direction first. It needs to gather fuel for the upcoming move. That means it needs to have as many participants as possible on the wrong side.
That may be the situation at hand.
We are keeping a close eye on GLD (and GDX via DUST) to position short.

2/7/16
Counter-intuitively, if a market is going to exhibit a sustained move in a particular direction, it typically moves in the opposite direction first.
The media must be abuzz with the launch higher in gold.
The chart at left is one way of looking at all the fanfare. GLD may be testing the underside of the trend break (and may do so for several days or weeks) before heading to lower levels.
A decisive (upward) break of the trend-line and subsequent hold above, would indicate that GLD is embarking on the counter-trend rally that has been forecast by various pundits since November of 2014! That is a long time to attempt (and get stopped out) of a trade that is taking its time to materialize (if/when it actually happens).
Note, that for the gold mining sector, there is significant (huge) overhead supply. The buy and hold crowd that has been "holding" all the way down from the September 2011 top, are emotionally exhausted and will be sellers into attempts to move higher. Their selling may limit or halt the rally or it may not. However, that selling will be there.
My intuitive opinion is that there has not been enough carnage in the gold sector to warrant a sustainable (year-long or multi-year long) rally in gold. The zombie miners are still zombie mining and have not shuttered operations (AUY, BVN, KGC, et al).
p.s. I have found from empirical observation that most if not all articles on Seeking Alpha may be used as a contrary indicator.
For example, I have not found any article or market researcher on Seeking Alpha that has a track record of calling market turning points to-the-day. Well, they do, but not in the way they think. :-)
Update: Upon review, the above statement may seem a bit harsh. However, to borrow a phrase from David Stockman, "Here's the thing": There is not one single market newsletter writer (or financial adviser for that matter) that I have seen in past and/or present that has his track record of recommendations posted up front (on their home page or anywhere else). It is all well and good to write exciting or informative copy and then make recommendations. However, when or if it does not pan out, the excuse is typically something like the jobs number, or earnings reports, or whatever were 'unexpected'.
The difference here (on this site), is that we are managing a corporate account through a historic juncture in the market. The outright and bold-faced objective for that account is "out-sized gains" (to use an industry term). There is no guarantee the objective will be met. However, we consider taking action, correcting if needed, then acting again a much better path than playing it 'safe' (with recommendations) while the biggest opportunity for profit in world history passes by.
There is always the exception (to the contrary indicator) and this juncture could certainly be that exception. However, we are continuing with the deflationary theme. Referring back to Prechter's statements from years ago ... when the markets enter a severe downdraft (a crisis or a crash), everyone; individuals, corporations, banks and countries will be selling anything that is not nailed down to raise cash. You can't raise cash by purchasing gold.

1/9/16
With another blip higher in gold, it is time to look at the charts.
Instead of looking at GLD, we are looking at the GDX, a confirming (or non-confirming in this case) index.
On an on, the pundits (and newsletter writers) have been stating that gold is “bottoming” or in a “bottoming process”.
This pundit line has essentially been in place since the peak in late 2011, following the “bottoming” all … the … way … down.
At some point there may indeed be a sustainable bottom.
However, one of the major mental errors of the average investor (and maybe some professionals as well) is that just because something is at a low level, it does not mean there will be an advance higher.
That type of thinking is a trap: A Mind Trap The GDX shows that it is currently in “mid-air”: That it has not completed its move that started at the top in 2011.
Certainly, moves can be aborted for some reason and advance or decline. However, the probabilities continue to point to lower levels for gold and the gold stocks.

12/29/15
With two trading sessions to go for the year, it looks like GLD is going to post an outside-down quarterly reversal bar.
Quarterly charts show where the large flow of funds is headed. At this point, those flows continue to move out of gold.
There may indeed be a short‑term sentiment based rally on the horizon. However, one has to ask … just where and how far is a rally (if/when it happens) going to go?
Unless there is immense demand, GLD may have trouble getting a sustainable medium-to-long term rally in place.
A sustainable rally would first have to reverse a 1.5 year long trend of continuous downward thrust. Then it would have to break through a year long downward trading channel and then it would need to maintain a trend of upward thrust.
Three major trend change events happening near simultaneously, is not probable. It could happen … such as resulting from a completely unexpected event.
However at this juncture, the larger, longer term view of GLD still points to downward pressure and lower levels.

12/12/15
The gold market continues to decline and it is building layer upon layer of resistance.
It is a psychological fact that when the market finally turns bullish, there will be selling into the move.
Those who rode the market all the way down (for years) are now emotionally exhausted and just want out.

11/4/15
As indicated in the Trading Room (update from 10/24/15), GLD was forecast to up-thrust the
attempted breakout and continue its trend lower.
We see on the chart at left that GLD failed to push above the 112.50 axis line and has reversed.
Fibonacci extension price targets are at this link.

10/24/15
GLD could still go either way.
Holding just below the support level, there appears to be lack of commitment to either direction.
Additional technical notes and forecast here.

10/14/15
GLD is either in an upside breakout or an up-thrust (heading to lower levels).
Technical details at this link.

10/7/15
GLD is still within the bounds of the wedge.
Price action at this point could go either way. Additional notes on the most probable direction are here.

10/1/15
GLD appears ready to break out to the downside.
If the wedge formation shown is in-effect, it projects a measured move to the 95 - area.
There was a significant amount of congestion at the 95 - level in '08 and '09. Expect to see buoyancy if/when GLD approaches this level.

9/19/15
Inverting the weekly chart of GLD, we see a potential test of a new trend-line.
Thus far, GLD is exhibiting normal bearish behavior.
A fail of the test line shown and continued down-side (up-side non inverted) action indicates a change of character to the bullish side

9/4/15
GLD attempts to penetrate resistance to the upside and fails.
With trader sentiment extreme at the break-down low (103.43), an upside attempt was expected.
The lack of follow-through on the upside thus far indicates a bearish condition.

8/20/15
Since there are now pundit rumblings about gold (and commodities in general) having made a bottom, it is time to revisit the long-term technical picture.
Because we are at a bearish sentiment extreme for gold, there may indeed be trading opportunities in the shorter time-frames.
However, if we look at the inverted chart of GLD on a quarterly (very long term) time-frame, we see that the market is actually accelerating higher: Long term, GLD is not showing that it has significantly changed its overall direction.

GLD has spent nearly two-years defining the width of the down-channel shown.
If this channel continues to remain in-effect, it is a long way down to any kind of sustainable demand.

With the price action in GLD continuing to sub-divide lower, now may be the right time to look at down-side projections.
With seemingly all eyes on Greece and China, it may be that the "catalyst" for a significant market move comes from an unexpected source (one thought to be the safe haven).
As stated in prior updates, there could be a counter-trend move at any point. Details on the specifics (and target area for such a move) are in the Market-Action section.
However, this market looks less and less likely to come up with the sufficient demand required to launch such a move.
A point to consider is that the gold (and silver) markets already know all about the supposed reasons for inflation.
If those known facts are not moving these markets higher, then the trend (for reasons that the market itself will reveal) is to lower levels.


The weekly chart of GLD shows that the ever-anticipated resumption of the bull market in gold has yet to arrive.
Anything can happen.
However, the probabilities indicate lower prices ahead for the sector.

A significant trend change in the precious metals sector appears to be getting under way now.
After working to position in this sector for the past five sessions (from 5/28/15 - 6/3/15), that initial position is complete and in the green as of 6/3/15. There is a potential for a medium to long term sustained move.
Trade Ticket number GLD-2015-002, scheduled for release on 5/31/15, is complete.
This research report is located in Market-Action.