
Biotech

10/7/17
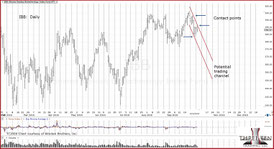
The weekly chart of IBB shows that Biotech has reached the danger point. Upside penetration was the weakest sustained up-move since November ’16.
The 340-area is also a 61.8% Fibonacci retrace level.
Expectations are for continued struggle at this level or reversal.
Charts by StockCharts

8/26/17: Biotech Spring to Up-thrust
What did we just say about springs and up-thrusts?
Paraphrasing David Weis from our 8/19/17, update:
‘I don’t know how many times I’ve seen a spring go straight into an up‑thrust.’
Well, here’s one example that just played out on Friday.
Biotech (IBB) has done just that: Spring to Up-thrust
This type of price action behavior has been going on since at least the early 1900’s and most likely, is centuries old.
It’s fractal in nature and repeats. It can be spotted setting up in real time once enough market (price action) experience has been obtained.
What to do about this particular set-up and how to capitalize … well, that’s a detailed topic and best suited for one-on-one discussions.

5/17/17:
Biotech Break
If there’s one sector that has the potential to essentially go straight down, it’s Biotech.
Some months ago, David Stockman analyzed the sector and summed it all up in two words: “bottled air”.
From the chart we see that IBB has retraced 38% of the prior move (culminating in an up-thrust during March of this year) while at the same time, continuing to post Fibonacci time relationships.
If the Fibonacci time relationship continues, there may be a low occurring some time in April of next year.
Where that low may occur, may be noted on a later chart with projected values.

12/7/16: Biotech Breakdown
Yesterday: "Price action will need to decline from this point forward ... "
Today: Biotech breaks hard. Currently down nearly 4%
The century old method of Wyckoff analysis performs yet again. It's no wonder this method is not discussed openly in the financial media. Their job is to obfuscate the truth.
Wyckoff is focused on truth; That truth is printed on the tape.
If biotech progresses lower, the decline may be swift and reach yearly lows prior to December 30th (last trading day).
Tax-loss selling might be a factor in an aggressive wash-out during the last week of the year.

12/6/16: Biotech Channel
Biotech (IBB) may be confirming its right side channel line. Price action will need to decline from this point forward to provide validation for that right side.
The S&P continues to bounce around the highs and IBB continues to erode.

11/28/16: Biotech Short Continues
IYR has farther to go on the upside. The trade has been closed.
The market keeps telling us where to go (or not to) and real estate looks like it needs more corrective upward action.
Meanwhile, back at Biotech, the short position has been increased. The chart shows the locations of each entry with the last one boosting the entire position up by a solid 67%.
The stop is relatively obvious … the prior (IBB) session high of 285.62, or the BIS low of 30.55.

11/24/16: Biotech Breakdown
The biotech story just keeps getting better … for the short side. Just when you thought it could not get any more obvious, we have this report.
Let’s look at the timing of the biotech setup over the past few months.
First, there was the ’Biotech Bull Market’, shown on the chart. Next it was ‘Biotech May Soar’ and now ’This’.
Look at each news announcement on the chart; coming out at the top and then lower levels.
If there's a clear example of the market about to get whacked, this is it.

Saturday, 11/19/16, Update: Follow The Money
Part of trading/investing successfully is to identify what the big players in the market are doing. Figure that out and stand-aside or get along-side.
The big players leave tracks and those tracks are embedded in the “tape”.
So, here we have an article that’s positive on the banks and biotech. What does that mean? Well, to us it means that big money somewhere, has not unloaded enough of their position or has not established enough of a short position to their liking.
They need one last ‘catalyst’ to push the market higher to complete their task. Exactly who the big player may be is not important. It’s the attempt to move the market higher that’s important.
The chart of IBB contains the truth on biotech: It’s stretched in a potential short‑covering rally and can’t push (and hold) above resistance.
Any attempted connection to government policies or future profit growth or whatever, in our view is more than misleading. We’ve got another name for it, but won’t use it here. The article’s (potentially false) narrative could change tomorrow and then change the day after that, ad infinitum. Read more.

11/17/16: Biotech, Up Close
As stated in the Biotech update (last night), it appears that demand has evaporated. No demand in a market that’s making no money (at least for about 75% of the index). And yet, IBB is at an elevated extreme.
Sure, demand could materialize out of thin air and push this index past resistance. Anything can happen and one needs to have a plan should that event transpire.
However, we already have market data (price action) that shows just as it did for GDX, that demand has faded. The probability now is a downward reversal.
For biotech, this is the danger point so oft referred to by Livermore and Wyckoff. The “psychological moment” as Livermore stated.
For our position in BIS at this juncture, the stop is 29.43, the prior session low. A push below that level indicates probability of IBB breaking (upward) through resistance.
Potential down-move target for IBB, is around 142.00: A down-draft of 50%.

11/16/16: Biotech Bottled Air
The chart of IBB is self-explanatory.
Where price action spends its time, defines the direction of trend
Price action is holding above resistance less and less.
With the last push above, (unless it moves higher from here) we see there's no demand at all.
It appears there is only one direction to go from here: Down
We're already short IBB via BIS. It might be time to increase the line.

11/12/16: Biotech Straight Up, Then Dead
Straight to resistance, then stops dead.
How will we know if this is a short-squeeze? The answer is, and always has been that once the squeeze is over, prices collapse.
An example of a short-squeeze ‘collapse’ is happening in the gold market now. As postulated on this site for months, the up move in gold may be just a squeeze on a massive scale.
Indeed, that premise appears to be validated.
The same goes for biotech. Price launches straight up into resistance and then stops dead.
Note how the daily volume (the demand) has all but disappeared in just two trading sessions.
The chart shows a possible outcome when the bids dry up: Island gap reversal.
Of course, there is no guarantee of that event. However, just the possibility of that type of move indicates positions are to be established (as they have) quickly.
If demand materializes (prices continue higher) and the short trade begins to erode, we'll exit.

11/11/16: Biotech. The Bubble That Keeps On Blowing
It’s almost a no-brainer. The huge move up in the biotech sector may just be a short‑covering spike.
From a risk standpoint, this is a trader/speculator’s dream come true.
Moves like this crush the shorts and embolden the bulls … at least temporarily.
The fundamental work has been done months, if not years ago. Very few companies in the biotech sector are making any money at all.
As reported by David Stockman over a year ago, most in the sector are just burning cash … and cash may be about to become highly desirable.
An initial position in BIS was entered yesterday. By the close, that position was down only -0.07 pts, from the entry. A good sign.
After this morning's open, BIS retraced slightly, allowing the opportunity to increase the line.
There's an intuitive sense that from here on out, market events are going to transpire with stunning speed.
Time to position or get out, in our opinion (remember, we don't and can't offer advice) is now.

10/23/16: GILD Trending Lower
Gilead Sciences (GILD) is the No. 2 market cap in the Biotech sector (IBB)
Its persistent downtrend and apparent H&S Neckline penetration have been influencing the sector for over 16-months.
Now we see that GILD may have tested the underside of the neckline break. If that test is complete, the expectation is for GILD to move towards the measured move target of 55.00
With the overall market (S&P) reaching a test of its own down channel this past Friday 10/21, probabilities favor continued downside price action for the overall market as well as the biotech sector and GILD.
In addition to the H&S pattern shown, there are Fibonacci time relationships as well as technical indicators that point to more downside action.
Those details are discussed (as well as how we are positioned) in the protected area located here.

10/18/16: Who's Not Invited?
The question during the pre-market is not how high and far the S&P will gap higher.
No, the question is: ‘Who is not participating in the move? Or, stating it a little differently, “Who’s participating the least in the upward move?”
At this point, the answer could be Biotech. That sector has been hit especially hard in the past three weeks and we have been on board (the short side) for nearly the entire time.
We’ll be watching this sector to see if there are any signs of a change in character to the bull side; or if it’s just a pause before more downward price destruction.
On the IBB chart above, there was not any time where price action came back above the short entry point(s). The long standing financial media lie is that "markets can't be timed." Putting it differently, they can't time the market and do not want anyone else to do it either.
If you're interested in improving your tape reading skills, feel free to contact us.

10/11/16: Biotech Hit Again
Once again, we have pre-market activity in Biotech … to the downside.
Shire PLC is taking the hit with over 14,000 shares traded (as of 8:55 a.m. EST) and down -1.75% in the pre-market. Shire is No. 5, in market capitalization for the biotech sector, IBB.
Of course, it makes sense that SHPG was just upgraded, right?
Looking at the chart of SHPG, even a freshman market technician can see the ascending wedge. A wedge pattern is a termination pattern: Market Analysis 101, we all know that.
SHPG has retraced 50% of the previous decline and is now re-asserting its bear market move.
So, why is SHPG moving lower? The answer is, and to paraphrase Livermore (from his book published in 1940), ‘It does not matter. It just is.’ Attempting to figure out the ‘why’ will only cloud the ability to discern price action.
Could biotech and SHPG recover? They could indeed. However, to do that would require a change of character. That gets us right back to discerning what price action is doing. It all goes back to truth: Price and price alone.

10/6/16: Biotech Bull Trap
It’s unusual for Biotech (IBB) to have any pre-market trading but that’s exactly what’s happening (8:39 a.m. EST) with nearly 3,000 shares traded.
It’s another clue that something’s up.
Based on the chart location of the pre-market (below the prior session low), we can conclude that a bull trap is complete.
If this price action holds, and declines throughout the upcoming session, we have confirmation of the trading channel. The fact that IBB continues to trade as this post is being generated and continues to drop, indicates we may be on the cusp of a significant decline.
Our objective was to get into position well in advance of this event so that we do not have to ‘chase’ the market. It has been approximately ten weeks of chart analysis (several entries and exits) along with a fundamental backdrop researched nearly one year ago.
Unless we are stopped out, our positioning objective has been accomplished. As Livermore stated nearly a century ago, it’s now time to ‘sit tight’.

10/5/16: Biotech (IBB) Update
While IBB price action negates one channel, it potentially confirms another.
This time, if the right side is not penetrated, we have three contact points. The lower channel line has two and possibly more if we extend upward into prior congestion.
In other markets, the bond reversal continues. The dollar moves higher and gold holds steady to slightly lower.
10/4/16: IBB Down Channel
IBB may be in a trading channel.
Today’s reversal confirmed the right side. However, volume was light. As always, the market rarely gives an absolute clear picture.
As a result of today’s action our stop in BIS was re-located: Details here.
Double, double, toil and trouble; Fire burn and cauldron bubble.

9/29/16: When we look at the P&F chart of the Biotech sector ETF (IBB), it looks impressive. The chart removes the factor of time and sometimes, P&F gives a more clear picture. In this case, there's no doubt, it's a bubble.
A wave of populism could be forming against this sector as well.
Our current position is discussed here.
Note: Title from Shakespeare's Macbeth. Charts by StockCharts

9/29/16: Biotech - S&P Divergence
Something happened to Biotech (IBB) after the 2/11/16, low: Money started flowing out.
While the S&P worked its way higher over the next six months, IBB went sideways. A sideways market builds congestion and congestion is fuel for the next move (either up or down).
We see at the Brexit low, IBB managed to move itself up into another sideways range … and then … the up-thrust.
It almost looks too good (for the shorts) to be true: A false breakout that has come back into the range and then an upside test (during yesterday’s 9/28, session).
Currently in the pre-market, the S&P is trading down about -0.22% (at 8:31 a.m. EST) and this may cut demand for IBB at the open; giving the shorts additional downside action.
We are positioned in the BIS ETF (inverse fund) with a well defined stop as seen here.

9/28/16: Biotech Not Invited
Biotech is not participating in current OPEC generated gyrations. It’s one more piece of important data.
Thus far, we have entered and rejected those markets that are still showing demand.
Basic Materials was showing demand at this session and the position was closed out.
Each move at these elevated levels provides additional data. What was thought to be an acceptable position (and may be in the future) is not acceptable now.
We are looking for who is NOT moving higher … or who is moving higher the least. At this point, Biotech refuses to join the party … more clues.

9/16/16: Biotech Pushes Higher
Biotech (IBB) continued to push higher past the danger point. In so doing, it may have gone far enough for that level to now become support.
Our short position was closed out early in the session. We are on the side lines to see how the sector performs at the next resistance level.

9/15/16: Biotech Breach
Once again, biotech is at a danger point. What was thought to be a bearish set-up at the last session, turned even more bearish at the current one.
Price action has penetrated resistance and closed above that resistance. The overall market (S&P) reached what may be a counter-trend extreme as well.
For biotech (IBB) to continue markedly higher, demand must come in to lift IBB decisively above the resistance level.
The nuance that points to a reversal is that penetration of resistance was not decisive and/or on heavy volume. It’s a precarious position. Additional (protected) notes on this event can be found here.

9/14/16: Biotech Reversal
Biotech (IBB) attempted an early session breakout higher that ultimately failed to hold.
Failed moves can be the most dynamic. The expectation for a false move higher (such as now) is to quickly head to the lower end of the current trading range; back to the 275 – area.

9/5/16: Underside Test?
It’s normal for a market to come back to test breakout levels. While biotech hangs by a tread as reported … it could still manage a push upward to the breakdown underside.
Our BIS trade is profitable at this point; detailed here. To minimize time in the market, we don’t want to wait through any type of testing action should it occur.
Danger points are just that. The market could go either way.
Somehow and from somewhere, volume and pressure could appear to drive IBB prices (upward) past the danger point. It’s always a possibility with any market situation. In response, the stops (in BIS) have been tightened as detailed here.
If prices come back to test, it may generate the lowest risk entry point to-date for a short position. That event will be evaluated if/when it happens.
This activity of positioning and re-positioning is normal in a trading environment.
Paraphrasing Dr. Alexander Elder, from his book “Come Into My Trading Room”: A professional course of action is to make several attempts in a particular market (if needed) to get the position desired.
Until price action shows otherwise, our overall view of Biotech (IBB) is bearish. There is potential for a significant move … possibly to 138.50, representing a 50% decline. It’s worth the effort to position and re-position for that opportunity.

9/3/16: Biotech Hangs By A Tread
The sector that is now in position to decline farthest and fastest is biotech.
Friday's sharp move higher in real estate (even though the move was retraced later in the day) took it out of immediate competition for the top spot ... and returned it to biotech.
On Friday, the overall market was higher and biotech continued to lag.
During the past seven months, it's built up a significant amount of congestion (overlapping price action ) which may provide the fuel for a sustained move.
Indeed, it could reverse from here. However, it now has significant upside resistance (built over a one month period) that would hold the sector back while it gathered upside momentum.
Probabilities (September, seasonally the worst month) favor more downside action.
4/25/16, 11:05 a.m. EST: CELG at the "danger point"
At $86-Billion Market Cap, CELG is the third largest equity in the IBB (Biotech) ETF. Therefore, it has the capacity to influence the overall sector. Read more.


3/28/16
IBB has broken its downtrend line shown in previous updates.
Typically, if there is a trend break, then a position is exited (as was the case with BIS).
However, the bearish outlook has not changed in this sector and the market as a whole. We are in search of a new entry location for a short position.
At this point, the most likely area for another opportunity (depending on price action) may be in the "Up-thrust zone". This location is both a 23.6% retrace of the entire down move in IBB from the 7/20/15, high (400.79) and a penetration of well established resistance.
If penetrated, this area would be an ideal location to re-evaluate the bearish opportunity.