
Coal & Energy

7/29/17:
Oil Price To Move Sharply Higher
Oil has been out of the limelight for so long … it’s almost been forgotten by the press and pundits.
These two charts show oil (using USO as the proxy) in position to move dramatically higher. A Wyckoff spring set-up is complete and underway.
Markets tend to move in typical fashion to a 161.8 Fibonacci extension. That would put the price of oil much higher than where it stands now.
USO: 7/29/17


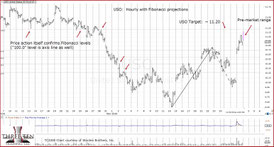
1/5/17: USO Pre-Market Higher
Pre-market in USO is right at the 50% Fibonacci retrace level.
If USO has reversed and is now forming a right side channel line, the expectation is for the 50% level to hold and for USO to decline during the session.
The press would have us believe the higher trade activity is the result of production cuts.

1/4/17: OXY Put Detail
The 30-minute chart of OXY provides detail on the Put transactions.
Time is running out for the 6th, so the put was extended with the open of the contract for the 13th.
Note the 71.50 put was opened as the market was rising into the trend-line. At that point, two separate positions were open … too much capital leverage to be held overnight.
As the market declined into the close, the 1/6/17, 72.00, Put was closed, yielding a profit of approximately 92%.
The 1/13/17, 71.50, Put remains open. It is slightly in-the-money (and in the green from the opening price).
If the trade fails and OXY begins to rise at the next session, the extra time value (expiring on the 13th) gives some amount of loss cushion for an exit.

1/3/17: Oil Reversal, Right At Target
The chart of USO shows the real story behind oil’s quick reversal.
Fundamentals do not move the markets. Wyckoff stated as much in his autobiography. Paraphrasing (we don’t have copyright approval):
‘There are forces at work moving prices around that have nothing to do with fundamentals’
Ed Seykota, highlighted in Market Wizards, re-iterated that fact as well and said any time he used fundamental data, he lost money.
From the chart, USO reached a 1.618, Fibonacci projection off the 11/14/16, low. The corrective move is over: That’s why oil reversed.
Of course, there are numerous other forces at work. Was this the last corrective move before oil resumes a down-trend? Well, we don’t know. If it is, price action itself, will decide.

12/14/16: XOP Inverted
Unusual pre-market activity in XOP: As of this post (8:44 a.m. EST), there have been two block trades of 50,000 and 22,500, representing transaction value of over $3-million.
While the S&P figures out if it's going to reverse, the XOP looks like it’s not waiting around: Currently down approx: -1.0% in pre-market activity.
The chart shows an inverted analysis. DUG loosely follows this representation. However, inverse funds have tracking errors so they do not exactly correlate to an inverted chart.
Nonetheless, if there's a place to be short, Oil & Gas Exploration appears ready for downside leadership.

12/12/16: XOP, The Place To Be ... Short
XOP, behaving as expected: High probability of up-thrust (false breakout and reversal).

12/12/16: XOM Up-thrust
Exxon (XOM) is in up-thrust position.
It’s well known and documented that XOM is paying out more that it’s taking in. Wonder why the CEO is leaving to be Secretary of State?
What a great low-risk opportunity on the short-side. DUG (inverse XOP) will gap-down at the open. It’s what happens next that’s important.
Extreme reversals typically show themselves within the first 60 – 90 minutes after the open.

12/6/16: XOP Down in Pre-market
Oil futures may be in a follow-through reversal from yesterday and leading XOP lower as well.
A previous XOP Fibonacci projection analysis was set aside as those projections were not adhering to price action. Further inspection of XOP shows that indeed, there's a Fibonacci relationship but taking place on a longer time-frame.
On the weekly chart, price action is respecting the projections identified as ‘contact points’.
If that continues and XOP reverses from here, then confirming the up-thrust (by heading below the 39.00 level) there’s potential for significant decline from current levels … a decline well over 70%.
The structure of that decline and how long it will take is for another time. However, it appears the initial stages of a reversal are taking place now.

12/5/16: XOP 50% Retrace
Pre-market activity in XOP shows a gap-up higher into resistance and the 50% retrace level.
The 42.50, area for XOP is about as far as it can go and not call the short position (via DUG) into question.
Oil is at an extreme as well, making a breakout attempt in the early hours (5-min chart).
Pre-market in the S&P shows it’s at a 50% retrace level also (SPY at 220.56 – 220.57): Everything’s moving in tandem.

12/2/16, 10:44 a.m. EST:
USO Danger Point
USO is at the extreme. This is the danger point.
While the financial media plays catch-up to create (false) narratives about constrained oil production causing rising prices … we see a very different pattern in the commodity itself.
Similar to what manifested in biotech (11/16/16, update), USO is spending less and less time above resistance.
The result in biotech is now obvious. The same event may play out for USO and the XOP.
Maintaining XOP, short position via DUG.

12/1/16, 1:24 p.m. EST:
XOP At The Highs
USO pushed though the Fib projection level detailed earlier so that analysis is being set aside for now.
Looking at the XOP, today’s session has less range and less volume thus far. On top of that, the highs are starting to erode just a bit.
Markets tend to come back and test their breakout levels. How XOP behaves if/when it does, will reveal if this is an up-thrust (reversal) or actual breakout.
We’re not waiting around to see what happens next but are already positioned in DUG with our finger on the sell trigger.

12/6/16: XOP Down in Pre-market
Oil futures may be in a follow-through reversal from yesterday and leading XOP lower as well.
A previous XOP Fibonacci projection analysis was set aside as those projections were not adhering to price action. Further inspection of XOP shows that indeed there is a Fibonacci relationship but taking place on a longer time-frame.
On the weekly chart, price action is respecting the projections identified as ‘contact points’.
If that continues, and XOP reverses from here, then confirms the up-thrust (by heading below the 39.00 level) there’s potential for a significant decline from current levels … a decline well over 70%.
The structure of that decline and how long it will take is for another time. However, it appears the initial stages of a reversal are taking place now.

12/5/16: USO, then, there were none
USO is not able to penetrate and hold above the 11.50, level.
It’s clear that demand at this level has essentially evaporated: 30 days, 2 days, 1 day, and then none.
Our trade stance is to maintain a bearish position in the oil sector via DUG.
12/1/16: USO, One More Push
The hourly chart of USO shows just a bit more to go before completing an a-b-c type corrective move.
USO looks to be ready to open gap-higher right at the Fibonacci extension level. Conversely, the inverse fund for oil and gas (DUG) is set to open lower.
Does anyone really think if OPEC cuts production, the U.S. producers won’t ramp up to save their own junk-bond leveraged hides?
Meanwhile, back at the oil patch, if USO opens at the 100.0, Fib projection level and begins to reverse, it’s a good indication that we’re done with this blip higher and the big players are also done with positioning short.
Any ‘surge’ past the 100.0, level (approx: 11.20 – 11.25, for USO) indicates something else is afoot. We’re at the danger point.

11/30/16: XOP Potential Up-Thrust
Risk is being reduced in the Oil & Gas sector.
As a result of the OPEC announcement, pre-market activity in XOP shows a strong gap-higher open.
Of course, OPEC cutting production is good news, right? By now, we should all know the answer to that question.
- The professionals need a ‘volume event’ enabling them to take (or cover) positions without being noticed.
In the case of Oil & Gas, we see months-long corrective action that got itself within spitting distance of penetrating resistance … where the stops are located.
Looks like XOP couldn't penetrate resistance on its own, so a volume event is created to help things along.
Once (and if) that resistance is penetrated, there’s a flurry of activity as stop orders of all kinds are executed: Buy stop (for bulls), Buy stop (for shorts covering), Sell stop (for bulls exiting) and Sell stop (for shorts initiating).
Oil and gas is in a long-term bear market. Probabilities are that if resistance is penetrated, the shorts will ultimately win.
Time to get ready. The inverse fund for the sector is DUG. We may abandon the nascent short position in SMN to allow funds for a short in Oil & Gas via DUG.
p.s. Most of the pre-market gap-higher activity in SPY is attributed to a gap higher pre-market in XOM.

9/21/16: Oil Down Draft Continues
The USO (proxy for oil) remains in a down channel. The long term prospects continue to be weak as indicated in this report.

1/3/16
The coal index has broken out of a six month long trading channel. There may be some January effect in the coming weeks. However, based on the position of the S&P, an upward bias in coal may be a low probability.
The typical investor thinks that just because something has reached a low level; it therefore must be a good value.
That idea is false.
Funds continue to flow out (or have nearly completed their exit) at this juncture. There may be some upside action in the coming week or two. Unless the chart proves otherwise, that action will likely be counter-trend and will run into resistance at the 30-area.
Our firm is not interested in counter-trend moves unless that is all there is. The channel breakout is a signal to cover shorts and not to initiate longs.
The S&P is poised to have significant downside action coming up.
That is where we want to be; with the trend and not counter-trend.

11/22/15
As expected, the coal sector continues its decline into what may be a final tax-loss selling move.
A wedge pattern is typically the last formation in any price action sequence (up or down).
Moving into the 14.00 - area would signify a sector loss of over 97% from the 504.66 high, set during April of 2011.

10/27/15
More potential downside ahead for BTU.
Note the 1:15 reverse split.
On a non-split adjusted basis, a move to the 6-area would put BTU at 40-cents.

9/12/15
The coal sector index may be forming a wedge pattern.
A wedge typically comes at the very end of a move. If that is true in this case, we have a potential measured target within the 20 area.
If DJUSCL makes it that low, it's a 96% decline from the 504.66 high set during the month of April '11.

9/5/15
As a result of the upward bounce, WLB has now confirmed a support level in the 11.00 area.
Going into the 4th Quarter '15, WLB is down for the year and therefore a tax-loss candidate.
How price action behaves as the year closes out, may determine if there is a potential to go long.

8/29/15
A faint heat-beat in the coal sector.
Note that the outside up weekly bar has only just made it to the next resistance level.
This may be a pause prior to lower levels (into the end of the year) or the beginnings of a reversal.

8/15/15
CNX is now within a few tenths of a point of the forecast shown in the previous post.
However, that does not mean that it is over. Just that an opportunity on the short-side has come to conclusion.
Looking at a longer time-frame, we can see that it may not be over in CNX for a while. The long time-frame targets a move to 11.00, and then potentially below the 6.00 level.

It appears that for CNX, the coal carnage is about to continue.
With price action in the bottom half of the wedge, a breakout lower is a higher probability than prices staging a rally from this point.

Update: 7/10/15, 12:59 EST
The DJUSCL Index made one more thrust lower at the start of the day's session (currently on-gong) and appears to be in a reversal.

The Coal/Energy sector may be at its lowest point for this market cycle and therefore, downside risk is low.
Behind all the coal sector carnage, WLB is quietly buying up mines and power plants.